
STATISTICAL TECHNIQUES IN BUS.+ECON.
18th Edition
ISBN: 9781260239478
Author: Lind
Publisher: RENT MCG
expand_more
expand_more
format_list_bulleted
Videos
Textbook Question
Chapter 8, Problem 2E
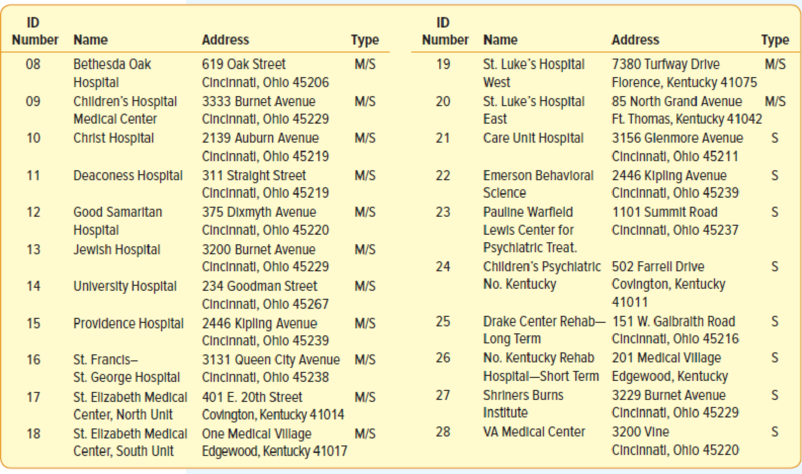
The following is a list of 29 hospitals in the Cincinnati, Ohio, and Northern Kentucky region. Each hospital is assigned a number, 00 through 28. The hospitals are classified by type, either a general medical/surgical hospital (M/S) or a specialty hospital (S). We are interested in estimating the average number of full- and part-time nurses employed in the area hospitals.
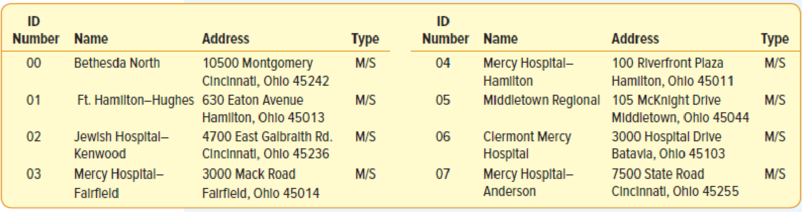
- a. A sample of five hospitals is to be randomly selected. The random numbers are 09, 16, 00, 49, 54, 12, and 04. Which hospitals are included in the sample?
- b. Use a table of random numbers to develop your own sample of five hospitals.
- c. Using systematic random sampling, every fifth location is selected starting with the second hospital in the list. Which hospitals will be included in the sample?
- d. Using stratified random sampling, select five hospitals. Four should be medical and surgical hospitals and one should be a specialty hospital. Select an appropriate sample.
Expert Solution & Answer
Want to see the full answer?
Check out a sample textbook solution
Students have asked these similar questions
08:34
◄ Classroom
07:59
Probs. 5-32/33
D
ا.
89
5-34. Determine the horizontal and vertical components
of reaction at the pin A and the normal force at the smooth
peg B on the member.
A
0,4 m
0.4 m
Prob. 5-34
F=600 N
fr
th
ar
0.
163586
5-37. The wooden plank resting between the buildings
deflects slightly when it supports the 50-kg boy. This
deflection causes a triangular distribution of load at its ends.
having maximum intensities of w, and wg. Determine w
and wg. each measured in N/m. when the boy is standing
3 m from one end as shown. Neglect the mass of the plank.
0.45 m
3 m
Examine the Variables: Carefully review and note the names of all variables in the dataset. Examples of these variables include:
Mileage (mpg)
Number of Cylinders (cyl)
Displacement (disp)
Horsepower (hp)
Research: Google to understand these variables.
Statistical Analysis: Select mpg variable, and perform the following statistical tests. Once you are done with these tests using mpg variable, repeat the same with hp
Mean
Median
First Quartile (Q1)
Second Quartile (Q2)
Third Quartile (Q3)
Fourth Quartile (Q4)
10th Percentile
70th Percentile
Skewness
Kurtosis
Document Your Results:
In RStudio: Before running each statistical test, provide a heading in the format shown at the bottom. “# Mean of mileage – Your name’s command”
In Microsoft Word: Once you've completed all tests, take a screenshot of your results in RStudio and paste it into a Microsoft Word document. Make sure that snapshots are very clear. You will need multiple snapshots. Also transfer these results to the…
Chapter 8 Solutions
STATISTICAL TECHNIQUES IN BUS.+ECON.
Ch. 8 - Prob. 1SRCh. 8 - Prob. 2SRCh. 8 - The following is a list of 24 Marcos Pizza stores...Ch. 8 - The following is a list of 29 hospitals in the...Ch. 8 - Listed below are the 35 members of the Metro...Ch. 8 - Listed next are the 27 Nationwide Insurance agents...Ch. 8 - The years of service of the five executives...Ch. 8 - Prob. 5ECh. 8 - Prob. 6ECh. 8 - Prob. 7E
Ch. 8 - Prob. 8ECh. 8 - Prob. 9ECh. 8 - There are five sales associates at Mid-Motors...Ch. 8 - Prob. 4SRCh. 8 - Prob. 11ECh. 8 - Prob. 12ECh. 8 - Prob. 13ECh. 8 - Prob. 5SRCh. 8 - Prob. 15ECh. 8 - Prob. 16ECh. 8 - Prob. 17ECh. 8 - Prob. 18ECh. 8 - Prob. 19CECh. 8 - The Medical Assurance Company is investigating the...Ch. 8 - Prob. 21CECh. 8 - Prob. 22CECh. 8 - Prob. 23CECh. 8 - Prob. 24CECh. 8 - Prob. 25CECh. 8 - As a part of their customer-service program,...Ch. 8 - Prob. 27CECh. 8 - Prob. 28CECh. 8 - Prob. 29CECh. 8 - The Appliance Center has six sales representatives...Ch. 8 - Prob. 31CECh. 8 - Prob. 32CECh. 8 - Prob. 33CECh. 8 - Prob. 34CECh. 8 - Prob. 35CECh. 8 - Prob. 36CECh. 8 - Prob. 37CECh. 8 - Prob. 38CECh. 8 - Prob. 39CECh. 8 - Prob. 40CECh. 8 - Prob. 41CECh. 8 - Human Resource Consulting (HRC) surveyed a random...Ch. 8 - Over the past decade, the mean number of hacking...Ch. 8 - Prob. 44CECh. 8 - Prob. 45CECh. 8 - Prob. 46DACh. 8 - Prob. 47DACh. 8 - Prob. 48DA
Knowledge Booster


Learn more about
Need a deep-dive on the concept behind this application? Look no further. Learn more about this topic, statistics and related others by exploring similar questions and additional content below.Similar questions
- Examine the Variables: Carefully review and note the names of all variables in the dataset. Examples of these variables include: Mileage (mpg) Number of Cylinders (cyl) Displacement (disp) Horsepower (hp) Research: Google to understand these variables. Statistical Analysis: Select mpg variable, and perform the following statistical tests. Once you are done with these tests using mpg variable, repeat the same with hp Mean Median First Quartile (Q1) Second Quartile (Q2) Third Quartile (Q3) Fourth Quartile (Q4) 10th Percentile 70th Percentile Skewness Kurtosis Document Your Results: In RStudio: Before running each statistical test, provide a heading in the format shown at the bottom. “# Mean of mileage – Your name’s command” In Microsoft Word: Once you've completed all tests, take a screenshot of your results in RStudio and paste it into a Microsoft Word document. Make sure that snapshots are very clear. You will need multiple snapshots. Also transfer these results to the…arrow_forward2 (VaR and ES) Suppose X1 are independent. Prove that ~ Unif[-0.5, 0.5] and X2 VaRa (X1X2) < VaRa(X1) + VaRa (X2). ~ Unif[-0.5, 0.5]arrow_forward8 (Correlation and Diversification) Assume we have two stocks, A and B, show that a particular combination of the two stocks produce a risk-free portfolio when the correlation between the return of A and B is -1.arrow_forward
- 9 (Portfolio allocation) Suppose R₁ and R2 are returns of 2 assets and with expected return and variance respectively r₁ and 72 and variance-covariance σ2, 0%½ and σ12. Find −∞ ≤ w ≤ ∞ such that the portfolio wR₁ + (1 - w) R₂ has the smallest risk.arrow_forward7 (Multivariate random variable) Suppose X, €1, €2, €3 are IID N(0, 1) and Y2 Y₁ = 0.2 0.8X + €1, Y₂ = 0.3 +0.7X+ €2, Y3 = 0.2 + 0.9X + €3. = (In models like this, X is called the common factors of Y₁, Y₂, Y3.) Y = (Y1, Y2, Y3). (a) Find E(Y) and cov(Y). (b) What can you observe from cov(Y). Writearrow_forward1 (VaR and ES) Suppose X ~ f(x) with 1+x, if 0> x > −1 f(x) = 1−x if 1 x > 0 Find VaRo.05 (X) and ES0.05 (X).arrow_forward
- Joy is making Christmas gifts. She has 6 1/12 feet of yarn and will need 4 1/4 to complete our project. How much yarn will she have left over compute this solution in two different ways arrow_forwardSolve for X. Explain each step. 2^2x • 2^-4=8arrow_forwardOne hundred people were surveyed, and one question pertained to their educational background. The results of this question and their genders are given in the following table. Female (F) Male (F′) Total College degree (D) 30 20 50 No college degree (D′) 30 20 50 Total 60 40 100 If a person is selected at random from those surveyed, find the probability of each of the following events.1. The person is female or has a college degree. Answer: equation editor Equation Editor 2. The person is male or does not have a college degree. Answer: equation editor Equation Editor 3. The person is female or does not have a college degree.arrow_forward
arrow_back_ios
SEE MORE QUESTIONS
arrow_forward_ios
Recommended textbooks for you
 College Algebra (MindTap Course List)AlgebraISBN:9781305652231Author:R. David Gustafson, Jeff HughesPublisher:Cengage Learning
 Glencoe Algebra 1, Student Edition, 9780079039897...AlgebraISBN:9780079039897Author:CarterPublisher:McGraw Hill
 Holt Mcdougal Larson Pre-algebra: Student Edition...AlgebraISBN:9780547587776Author:HOLT MCDOUGALPublisher:HOLT MCDOUGAL
 Big Ideas Math A Bridge To Success Algebra 1: Stu...AlgebraISBN:9781680331141Author:HOUGHTON MIFFLIN HARCOURTPublisher:Houghton Mifflin Harcourt
College Algebra (MindTap Course List)
Algebra
ISBN:9781305652231
Author:R. David Gustafson, Jeff Hughes
Publisher:Cengage Learning
Glencoe Algebra 1, Student Edition, 9780079039897...
Algebra
ISBN:9780079039897
Author:Carter
Publisher:McGraw Hill
Holt Mcdougal Larson Pre-algebra: Student Edition...
Algebra
ISBN:9780547587776
Author:HOLT MCDOUGAL
Publisher:HOLT MCDOUGAL
Big Ideas Math A Bridge To Success Algebra 1: Stu...
Algebra
ISBN:9781680331141
Author:HOUGHTON MIFFLIN HARCOURT
Publisher:Houghton Mifflin Harcourt
Hypothesis Testing using Confidence Interval Approach; Author: BUM2413 Applied Statistics UMP;https://www.youtube.com/watch?v=Hq1l3e9pLyY;License: Standard YouTube License, CC-BY
Hypothesis Testing - Difference of Two Means - Student's -Distribution & Normal Distribution; Author: The Organic Chemistry Tutor;https://www.youtube.com/watch?v=UcZwyzwWU7o;License: Standard Youtube License