STATISTICAL TECHNIQUES IN BUS.+ECON.
18th Edition
ISBN: 9781260239478
Author: Lind
Publisher: RENT MCG
expand_more
expand_more
format_list_bulleted
Concept explainers
Textbook Question
Chapter 8, Problem 20CE
The Medical Assurance Company is investigating the cost of a routine office visit to family-practice physicians in the Rochester, New York, area. The following is a list of 39 family-practice physicians in the region. Physicians are to be randomly selected and contacted regarding their charges. The 39 physicians have been coded from 00 to 38. Also noted is whether they are in practice by themselves (S), have a partner (P), or are in a group practice (G).
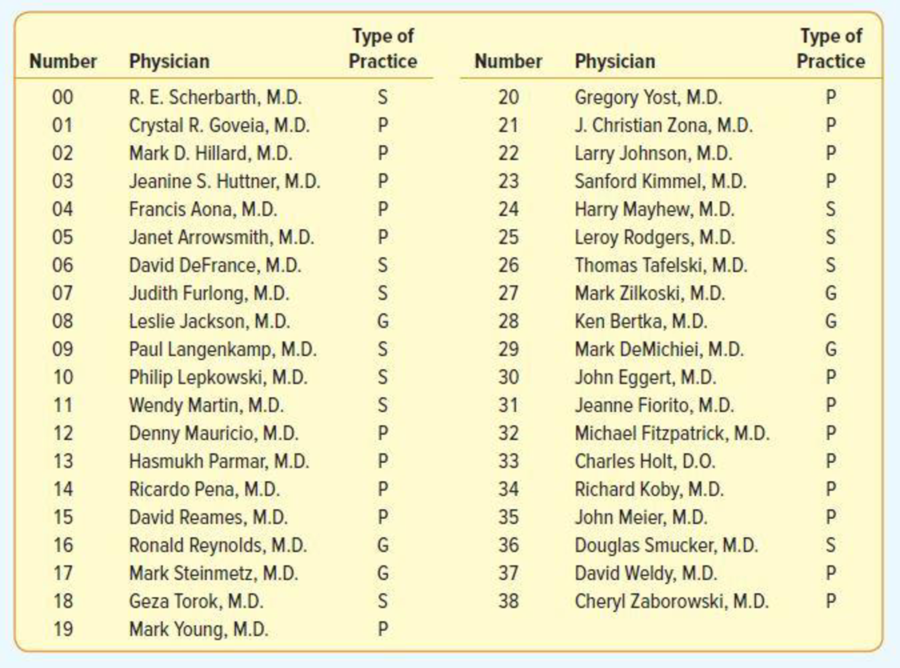
- a. The random numbers obtained from Appendix B.4 are 31, 94, 43, 36, 03, 24, 17, and 09. Which physicians should be contacted?
- b. Select a random sample of four physicians using the random numbers of Appendix B.4.
- c. Using systematic random sampling, every fifth physician is selected starting with the fourth physician in the list. Which physicians will be contacted?
- d. Select a sample that includes two physicians in solo practice (S), two in partnership (P), and one in group practice (G). Explain your procedure.
Expert Solution & Answer
Want to see the full answer?
Check out a sample textbook solutionStudents have asked these similar questions
One hundred students were asked which fast food restaurants they had visited in thepast month. The results are as follows:47 ate at McDonald’s;46 ate at Taco Bell;44 ate at Wendy’s;17 ate at McDonald’s and Taco Bell;19 ate at Taco Bell and Wendy’s;22 ate at Wendy’s and McDonald’s;13 ate at all three.Determine how many ate only at McDonald’s.
A fast-food restaurant compiled the following information regarding its employees.20 cooked or worked the drive-through window. 10 cooked only6 worked drive-through window onlyHow many of the employees cooked and worked drive-through window ?
A state fisheries commission wants to estimate the number of bass caught in a given
lake during a season in order to restock the lake with the appropriate number of
young
fish. The commission has information on the seasonal catch (CATCH) in
thousands of bass per square mile; the size of the lake in square miles (SIZE); the
number of lakeshore residences per square mile (RESIDENCE); the number of living
places for bass (i.e. weed beds, sunken trees, drop offs etc.) (STRUCTURE) and
ACCESS a dummy variable equal to 1 if the lake has public access and 0 if not.
САТCH
RESIDENCE
SIZE
АСCESS
STRUCTURE
3.6
92.2
0.21
81
0.8
86.7
0.30
26
2.5
80.2
0.31
52
2.9
87.2
0.40
64
1.4
64.9
0.44
40
0.9
90.1
0.56
22
3.2
60.7
0.78
80
2.7
50.9
1.21
60
2.2
86.1
0.34
1.
30
5.9
90.0
0.40
1
90
3.3
80.4
0.52
1.
74
2.9
75.0
0.66
1.
50
3.6
70.0
0.78
1
61
2.4
64.6
0.91
40
1.9
50.0
1.10
1.
22
2.0
50.0
1.24
1
50
1.9
51.2
1.47
1.
37
3.1
40.1
2.21
1
61
2.6
45.0
2.46
1.
39
3.4
50.0
2.80
1
53
(a) What do you think are the…
Chapter 8 Solutions
STATISTICAL TECHNIQUES IN BUS.+ECON.
Ch. 8 - Prob. 1SRCh. 8 - Prob. 2SRCh. 8 - The following is a list of 24 Marcos Pizza stores...Ch. 8 - The following is a list of 29 hospitals in the...Ch. 8 - Listed below are the 35 members of the Metro...Ch. 8 - Listed next are the 27 Nationwide Insurance agents...Ch. 8 - The years of service of the five executives...Ch. 8 - Prob. 5ECh. 8 - Prob. 6ECh. 8 - Prob. 7E
Ch. 8 - Prob. 8ECh. 8 - Prob. 9ECh. 8 - There are five sales associates at Mid-Motors...Ch. 8 - Prob. 4SRCh. 8 - Prob. 11ECh. 8 - Prob. 12ECh. 8 - Prob. 13ECh. 8 - Prob. 5SRCh. 8 - Prob. 15ECh. 8 - Prob. 16ECh. 8 - Prob. 17ECh. 8 - Prob. 18ECh. 8 - Prob. 19CECh. 8 - The Medical Assurance Company is investigating the...Ch. 8 - Prob. 21CECh. 8 - Prob. 22CECh. 8 - Prob. 23CECh. 8 - Prob. 24CECh. 8 - Prob. 25CECh. 8 - As a part of their customer-service program,...Ch. 8 - Prob. 27CECh. 8 - Prob. 28CECh. 8 - Prob. 29CECh. 8 - The Appliance Center has six sales representatives...Ch. 8 - Prob. 31CECh. 8 - Prob. 32CECh. 8 - Prob. 33CECh. 8 - Prob. 34CECh. 8 - Prob. 35CECh. 8 - Prob. 36CECh. 8 - Prob. 37CECh. 8 - Prob. 38CECh. 8 - Prob. 39CECh. 8 - Prob. 40CECh. 8 - Prob. 41CECh. 8 - Human Resource Consulting (HRC) surveyed a random...Ch. 8 - Over the past decade, the mean number of hacking...Ch. 8 - Prob. 44CECh. 8 - Prob. 45CECh. 8 - Prob. 46DACh. 8 - Prob. 47DACh. 8 - Prob. 48DA
Knowledge Booster
Learn more about
Need a deep-dive on the concept behind this application? Look no further. Learn more about this topic, statistics and related others by exploring similar questions and additional content below.Similar questions
- Name the four characteristics of a good definition.arrow_forwardA state fisheries commission wants to estimate the number of bass caught in a given lake during a season in order to restock the lake with the appropriate number of young fish. The commission has information on the seasonal catch (CATCH) in thousands of bass per square mile; the size of the lake in square miles (SIZE); the number of lakeshore residences per square mile (RESIDENCE); the number of living places for bass (i.e. weed beds, sunken trees, drop offs etc.) (STRUCTURE) and ACCESS a dummy variable equal to 1 if the lake has public access and 0 if not. What do you think are the expected signs of the regression coefficients? Justify your choice. Using R-studio, estimate the multiple linear regression model. ALL input codes and output tables should be provided. (b) Is the overall regression equation statistically significant at the 1% level? Justify your answer. Ensure that you state the null hypothesis(es) and the decision rule in your analysis. (c) Find and interpret a 95%…arrow_forwardA survey of 400 school empl yielded the following information: 295 were instructors, 215 were full-time faculty, and 170 ofthe instructors were full-time faculty. How many of the 400 surveyed school employees were instructors or were full-time faculty?arrow_forward
- Scott surveyed 40 friends on Facebook and asked them where they were born and where they went to college. He then categorized the data by whether they were born in Arizona (or not) and whether they went to college in Arizona (or not). The data are below. 21 people were born in Arizona 17 people went to college in Arizona 9 people were born in Arizona and went (or go) to college in Arizona a) How many people were born in Arizona and did not go to college in Arizona? b) How many people did not go to college in Arizona? c) How many people were neither born in Arizona nor went to college in Arizona?arrow_forwardThe following monthly salaries for supervisors from six different counties were reported: $5456 (Kern), $5166 (Monterey), $4443 (Santa Cruz), $4129 (Santa Barbara), $2600 (Placer), and $2220 (Merced). San Luis Obispo County supervisors are supposed to be paid the average of the two counties among these six in the middle of the salary range. (a) Which measure of center determines this salary? medianmean What is its value? (Enter your answer as a whole number.)$ (b) Why is the other measure of center featured in this section not as favorable to these supervisors (although it might appeal to taxpayers)? Since the median salary is smaller, the median salary is less favorable to the supervisors.Since the mean salary is smaller, the mean salary is less favorable to the supervisors.arrow_forwardThe Social Security Office kept records on salary history and age of all US citizens (with social security numbers) The Medicare Office kept health hustories and premium information on all US citizens and wanted to combine salary information with their records by matching up social security numbers. This data manipalation is known as O a attaching O b. supplementing O cindexing Ⓒd.appendingarrow_forward
- Espa Kala has two ways to travel from her home in Norco to her office in Los Angeles. One is to go via the 10 Freeway, and the other is to go via 60 Freeway. In order to determine which way she should travel on a daily basis, Kala has recorded the travel times for samples of fourteen trips via the 10 Freeway and fourteen trips via the 60 Freeway. The following table gives the travel times (in minutes) for the twenty-eight trips. Travel times in minutes 10 Freeway 67, 71, 69, 67, 74, 73, 70, 76, 74, 74, 69, 75, 67, 73 60 Freeway 75, 69, 69, 78, 75, 75, 71, 79, 81, 76, 77, 70, 74, 74 Send data to calculator Send data to Excel Assume that the two populations of travel times are normally distributed and that the population variances are equal. Can we conclude, at the 0.01 level of significance, that the mean vel time via the 10 freeway, is different from µ,, the mean travel time via the 60 freeway? Perform a two-tailed test. Then complete the parts below. Carry your intermediate…arrow_forwardIn a survey of 3343 adults aged 57 through 85 years, it was found that 83.3%of them used at least one prescription medication. Complete parts (a) through (c) below. a. How many of the 3343 subjects used at least one prescription medication?arrow_forwardAn electronics store receives a shipment of 30graphing calculators, including 6 that are defective. Four of the calculators are selected to be sent to a local high school. a. How many selections can be made using the original shipment? b. How many of these selections will contain no defective calculators?arrow_forward
- In the Aloha state, you are very unlikely to be murdered! However, it is considerably more likely that your house might be burgled, your car might be stolen, or you might be punched in the nose. That said, Hawaii is still a great place for a vacation or, if you are very lucky, to live. The following numbers represent the crime rates per 100,000 population in Hawaii: murder, 1.6; rape, 21.4; robbery, 95.3; house burglary, 903.6; motor vehicle theft, 521.7; assault, 106.3. (a) Display this information in a Pareto chart, showing the crime rate for each category. (b) Could the information as reported be displayed as a circle graph? Explain. Hint: Other forms of crime, such as arson, are not included in the information. In addition, some crimes might occur together. A. Yes, but the graph would take into account only multiple crimes and not these particular individual crimes. B. Yes, the graph would be able to account for all information. C. No, the graph would be unable to account…arrow_forwardRead the following prompt and complete the subquestions 3.a, 3.b, and 3.carrow_forwardIn the Aloha state, you are very unlikely to be murdered! However, it is considerably more likely that your house might be burgled, your car might be stolen, or you might be punched in the nose. That said, Hawaii is still a great place for a vacation or, if you are very lucky, to live. The following numbers represent the crime rates per 100,000 population in Hawaii: murder, 3.6; rape, 29.4; robbery, 79.3; house burglary, 867.6; motor vehicle theft, 531.7; assault, 118.3. Could the information as reported be displayed as a circle graph? Explain. Hint: Other forms of crime, such as arson, are not included in the information. In addition, some crimes might occur together.arrow_forward
arrow_back_ios
SEE MORE QUESTIONS
arrow_forward_ios
Recommended textbooks for you
- Holt Mcdougal Larson Pre-algebra: Student Edition...AlgebraISBN:9780547587776Author:HOLT MCDOUGALPublisher:HOLT MCDOUGALElementary Geometry For College Students, 7eGeometryISBN:9781337614085Author:Alexander, Daniel C.; Koeberlein, Geralyn M.Publisher:Cengage,
Holt Mcdougal Larson Pre-algebra: Student Edition...
Algebra
ISBN:9780547587776
Author:HOLT MCDOUGAL
Publisher:HOLT MCDOUGAL
Elementary Geometry For College Students, 7e
Geometry
ISBN:9781337614085
Author:Alexander, Daniel C.; Koeberlein, Geralyn M.
Publisher:Cengage,
Sampling Methods and Bias with Surveys: Crash Course Statistics #10; Author: CrashCourse;https://www.youtube.com/watch?v=Rf-fIpB4D50;License: Standard YouTube License, CC-BY
Statistics: Sampling Methods; Author: Mathispower4u;https://www.youtube.com/watch?v=s6ApdTvgvOs;License: Standard YouTube License, CC-BY