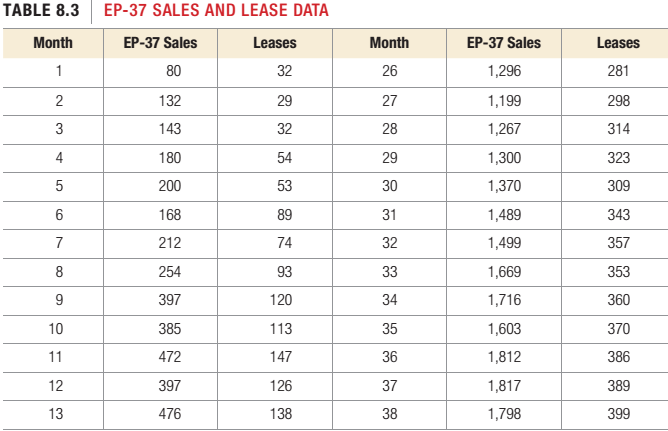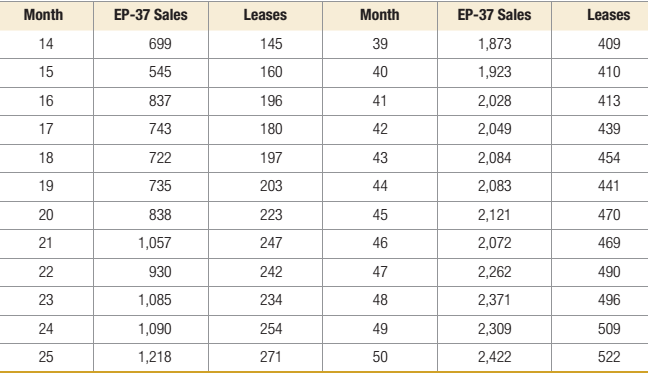
The Midwest Computer Company serves a large number of businesses in the Great Lakes region. The company sells supplies and replacements and performs service on all computers sold through seven sales offices. Many items are stocked, so close inventory control is necessary to assure customers of efficient service. Recently, business has been increasing, and management is concerned about stockouts. A
- Develop a trend projection with regression solution using OM Explorer. Forecast demand for month 51.
- A consultant to Midwest’s management suggested that new office building leases would be a good leading indicator for company sales. The consultant quoted a recent university study finding that new office building leases precede office equipment and supply sales by 3 months. According to the study findings, leases in months 1 would affect sales in month 4, leases in months 2 would affect sales in month 5, and so on. Use POM for Windows’ linear regression module to develop a forecasting model for sales, with leases as the independent variable. Forecast sales for month 51.
- Which of the two models provides better forecasts? Explain.


Want to see the full answer?
Check out a sample textbook solution
Chapter 8 Solutions
MyLab Operations Management with Pearson eText -- Access Card -- for Operations Management: Processes and Supply Chains
Additional Business Textbook Solutions
Marketing: An Introduction (13th Edition)
Intermediate Accounting (2nd Edition)
Essentials of MIS (13th Edition)
Principles of Operations Management: Sustainability and Supply Chain Management (10th Edition)
Gitman: Principl Manageri Finance_15 (15th Edition) (What's New in Finance)
- i). Complete the table for a Chase production plan. ii). Explain whether a Level or Chase plan is more suitable for the demand pattern experienced by this particular business, which incidentally relies on highly skilled workers in the production process. Assume a starting workforce of 7 and that fractional workers are permissible. You should support your answer with numerical data derived from Table 3. In comparing the costs, state any other assumptions made.arrow_forwardi). Complete for a Chase production plan. ii). Explain whether a Level or Chase plan is more suitable for the demand pattern experienced by this particular business, which incidentally relies on highly skilled workers in the production process. Assume a starting workforce of 7 and that fractional workers are permissible.arrow_forwardComplete the table for a Chase production plan.arrow_forward
- How much can the garden centre expect to sell during each quarter of next year (Year 3) accounting for seasonality? Your forecast must make use of seasonal indices. All workings must be shown in full. (NOTE: Please round your calculations to three decimal places).arrow_forwardPS.53 Brother I.D. Ricks is a faculty member at BYU-Idaho whose grandchildren live in Oklahoma and California. He and his wife would like to visit their grandchildren at least once a year in these states. They currently have one vehicle with well over 100,000 miles on it, so they want to buy a newer vehicle with fewer miles and that gets better gas mileage. They are considering two options: (1) a new subcompact car that would cost $18,750 to purchase or (2) a used sedan that would cost $12,750.They anticipate that the new subcompact would get 37 miles per gallon (combined highway and around town driving) while the sedan would get 26 miles per gallon. Based on their road tripping history they expect to drive 13,000 miles per year. For the purposes of their analysis they are assuming that gas will cost $2.93 per gallon.Question: How many miles would the Ricks need to drive before the cost of these two options would be the same? (Display your answer to the nearest whole number.) (Hint:…arrow_forwardTisjTzktxyduduarrow_forward
- Not use ai pleasearrow_forwardNot use ai pleasearrow_forwardWhat is Bitcoin? How important is it to businesses and individuals? How does it cause environmental damage and is that damage worth continued uses of Bitcoin? Read the following articles to help answer these questions: United Nations University. (2023, October 24). UN study reveals the hidden environmental impacts of bitcoin: Carbon is not the only harmful by-product. https://unu.edu/press-release/un-study-reveals-hidden-environmental-impacts-bitcoin-carbon-not-only-harmful-product#:~:text=Bitcoin%2C%20the%20most%20popular%20cryptocurrency,the%20worldwide%20Bitcoin%20mining%20network. Salam, E. (2023, April 26). Bitcoin is terrible for the environment – can it ever go green? The Guardian. https://www.theguardian.com/technology/2023/apr/26/bitcoin-mining-climate-crisis-environmental-impactarrow_forward
- 419 X .com/courses/1546/assignments/49499?module_item_id=111573 Unlimited Attempts Allowed ✓ Details Directions: Record a video of yourself giving a business presentation. Imagine you are tasked with researching a professional development topic on business communication for 40 coworkers. You are then expected to give a 4 - 5 minute presentation on the topic. Choose any topic related to business communication, such as intercultural communication, effective leadership, professional writing, etc. Research the topic and prepare a 4 - 5 minute presentation that could be given over video conference call (such as Zoom). You may use visual aids if you choose. Upload a video file of your presentation. Provide all needed citations. Requirements: 4-5 minutes long Contains visual and audio Create your own work; do not plagiarize Cite your sources using APA citations Choose a submission type Tarrow_forwardacts Container chips (s 150 cussion: Conflict X + e.com/courses/1546/discussion_topics/15722?module_item_id=111559 24 Winter > Discussions > Week 8 Discussion: Conflict 时☆ 26 Replies, 26 Unread Week 8 Discussion: Conflict Write a 200 - 300 word discussion post based on the prompt below. Reply to at least one other student in 50 - 100 words. Can you think of a time when a conflict led to a new opportunity, better understanding, or other positive result? If not, think of a past conflict and imagine a positive outcome. Discuss the impact of this conflict on your workplace relationships, productivity, and innovation. Source: Business Communication for Success. (2015). University of Minnesota Libraries Publishing. Attribution-NonCommerical-ShareAlike. Edit View Insert Format Tools Table 12ptv Paragraph BIUA T2arrow_forwardHow would you design and implement a modern networking solution for JAMS Manufacturing to connect all their facilities and ensure seamless communication? The company currently has standalone systems in three manufacturing plants and an office building, each using its own modem or router for internet access. The goal is to create private networks for each location, connect them to one another, and provide Internet access to all. You’ll need to consider factors like new computer systems, servers, and telecommunications wiring, and explain how your solution will benefit the company and how it will be implemented effectively.arrow_forward
 Contemporary MarketingMarketingISBN:9780357033777Author:Louis E. Boone, David L. KurtzPublisher:Cengage Learning
 Purchasing and Supply Chain ManagementOperations ManagementISBN:9781285869681Author:Robert M. Monczka, Robert B. Handfield, Larry C. Giunipero, James L. PattersonPublisher:Cengage Learning
 Practical Management ScienceOperations ManagementISBN:9781337406659Author:WINSTON, Wayne L.Publisher:Cengage,
- MarketingMarketingISBN:9780357033791Author:Pride, William MPublisher:South Western Educational Publishing


