Concept explainers
Spreadsheet Exercise
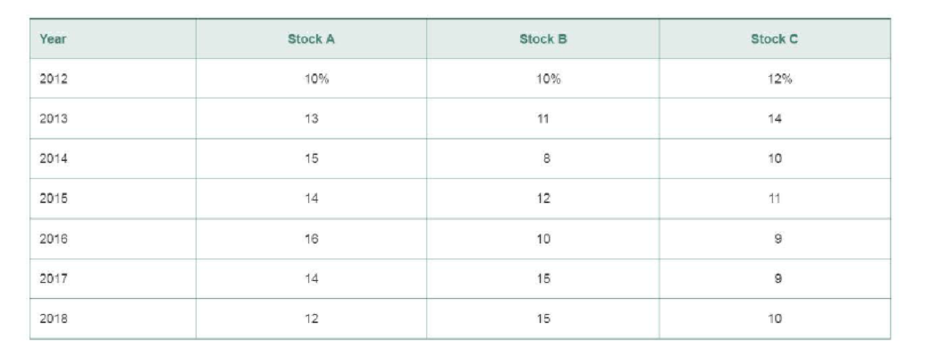
Jane is considering investing in three different stocks or creating three distinct two-stock portfolios. Jane views herself as a rather conservative investor. She is able to obtain historical returns for the three securities for the years 2012 through 2018. The data are given in the following table.

In any of the possible two-stock portfolios, the we1ght of each stock m the portfolio will be 50%. The three possible portfolio combinations are AB, AC, and BC.
To Do
Create a spreadsheet similar to Tables 8.6 and 8.7 to answer the following:
- a. Calculate the average return for each individual stock.
- b. Calculate the standard deviation for each individual stock.
- c. Calculate the average returns for portfolios AB, AC, and BC.
- d. Calculate the standard deviations for portfolios AB, AC, and BC.
- e. Would you recommend that Jane invest in the single stock A or the portfolio consisting of stocks A and B? Explain your answer from a risk-return viewpoint
- f. Would you recommend that Jane invest in the single stock B or the portfolio consisting of stocks B and C? Explain your answer from a risk-return viewpoint
My Lab Finance Visit www.pearson.com/mylab/finance for Chapter Case: Analyzing Risk and Return on Chargers Products’ Investments, Group Exercises, and numerous online resources.
Want to see the full answer?
Check out a sample textbook solution
Chapter 8 Solutions
Gitman: Principl Manageri Finance_15 (15th Edition) (What's New in Finance)
- a) Calculate the expected return for Stock Media Prima and Stock Astronote: No need excel formula!arrow_forwardeBook An individual has $10,000 invested in a stock with a beta of 0.4 and another $60,000 invested in a stock with a beta of 2.5. If these are the only two investments in her portfolio, what is her portfolio's beta? Do not round intermediate calculations. Round your answer to two decimal places. BAarrow_forwardJamie Wong is thinking of building an investment portfolio containing two stocks, L and M. Stock L will represent 50% of the dollar value of the portfolio, and stock M will account for the other 50%. The historical returns over the next 6 years, 2013−2018,for each of these stocks are shown in the following table: (see attached table) d. How would you characterize the correlation of returns of the two stocks L and M? e. Discuss any benefits of diversification achieved by Jamie through creation of the portfolio.arrow_forward
- You are planning for long term investment in a stock. After specific analysis you have two options i.e., Stocks of Company A and Stocks of Company B. You have following data on the stock prices of both companies; Time Line Share A Share B 2010 15 125 2020 41 320 Please select the share that is more likely give you better return in the long run. Also, show your selection process.arrow_forwardCreating your Stock Market Portfolio 1. Choose no less than 3 companies that you would like to invest $10,000 in. Write their names and ticker symbol on the chart. 2. Determine how much of your $10,000 you want to invest in for each stock. (Spread the $10,000 among the different companies, do not put it all in one stock). 3. Use a website such as Google Finance, Yahoo Finance, CNBC. to find today's price. 4. To find the total number of shares, Amount invested ÷ today's price I Name of Ticker Symbol Amount Invested Today's Price per Total Number of share (April 14) Company Sharesarrow_forwardGive typing answer with explanation and conclusionarrow_forward
- You are considering an investment in either individual stocks or a portfolio of stocks. The two stocks you are researching, Stock A and Stock B, have the following historical returns: Year TB 2017 2018 2019 -7.00% 25.00 -13.00 2020 49.00 2021 13.00 FA -16.00% 41.00 24,00 -5.00 23.00 a. Calculate the average rate of return for each stock during the 5-year period. Do not round Intermediate calculations. Round your answers to two decimal places. Stock A: % Stock B: b. Suppose you had held a portfolio consisting of 50% of Stock A and 50% of Stock B. What would have been the realized rate of return on the portfolio in each year? What would have been the average return on the portfolio during this period? Do not round intermediate calculations. Round your answers to two decimal places. Negative values, if any, should be Indicated by a minus sign. Year 2017 2018 2019 % Portfolio % % % % 2020 2021 Average return c. Calculate the standard deviation of returns for each stock and for the…arrow_forwardc) Calculate the covariance for the above stockNote: No need excel formulaarrow_forwardYou are considering an investment in either individual stocks or a portfolio of stocks. The two stocks you are researching, Stock A and Stock B, have the following historical returns: Year FA IB 2017 -17.00% -8.00% 2018 34.00 14.00 2019 29.00 -18.00 2020 -5.00 55.00 2021 21.00 19.00 a. Calculate the average rate of return for each stock during the 5-year period. Do not round intermediate calculations. Round your answers to two decimal places. Stock A: % Stock B: % b. Suppose you had held a portfolio consisting of 50% of Stock A and 50% of Stock B. What would have been the realized rate of return on the portfolio in each year? What would have been the average return on the portfolio during this period? Do not round intermediate calculations. Round your answers to two decimal places. Negative values, if any, should be indicated by a minus sign.arrow_forward
- You decide to form a portfolio of the following amounts invested in the following stocks. What is the beta of the portfolio? SET YOUR CALCULATOR TO 4 DECIMAL PLACES THEN INPUT THE ANSWER ROUNDING TO 2 DECIMALS i.e. your answer is 1.2455, enter it as 1.25. Stock Amount Beta Apple $1,118 0.49 Microsoft $8,931 1.61 $4,479 1.36 $5,994 0.76 Ford Time Warner Expected Return 10.50% 16.90% 15.75% 11.80% 3arrow_forwardSam has her portfolio invested as indicated in the following table. Stock $'s Invested Beta LCAV $150,000 0.50 DFIB $100,000 0.75 GLW $100,000 0.80 DLM $50,000 1.45 Find the beta of Sam's portfolio.arrow_forwardQUESTION 1 Aisyah is a new investor; she approached RHB Securities and the firm has provided her with the following information. Probability (%) Expected return (%) Stock X Stock Y 20 13 15 30 14 13 50 15 12 Using these stocks, she has identified two investment portfolio alternatives: Alternative 1 50% Stock X, 50% Stock Y Alternative 2 60% Stock X, 40% Stock Y Required: a. Calculatethe expected return and the standard deviation for Stock X and Stock Y.arrow_forward
 Pfin (with Mindtap, 1 Term Printed Access Card) (...FinanceISBN:9780357033609Author:Randall Billingsley, Lawrence J. Gitman, Michael D. JoehnkPublisher:Cengage Learning

