Concept explainers
Draw the influence lines for the vertical reactions at supports A and C.
Draw the influence lines for the shear and bending moment at point B.
Explanation of Solution
Calculation:
Apply a 1 k unit moving load at a distance of x from left end A.
Sketch the free body diagram of beam as shown in Figure 1.
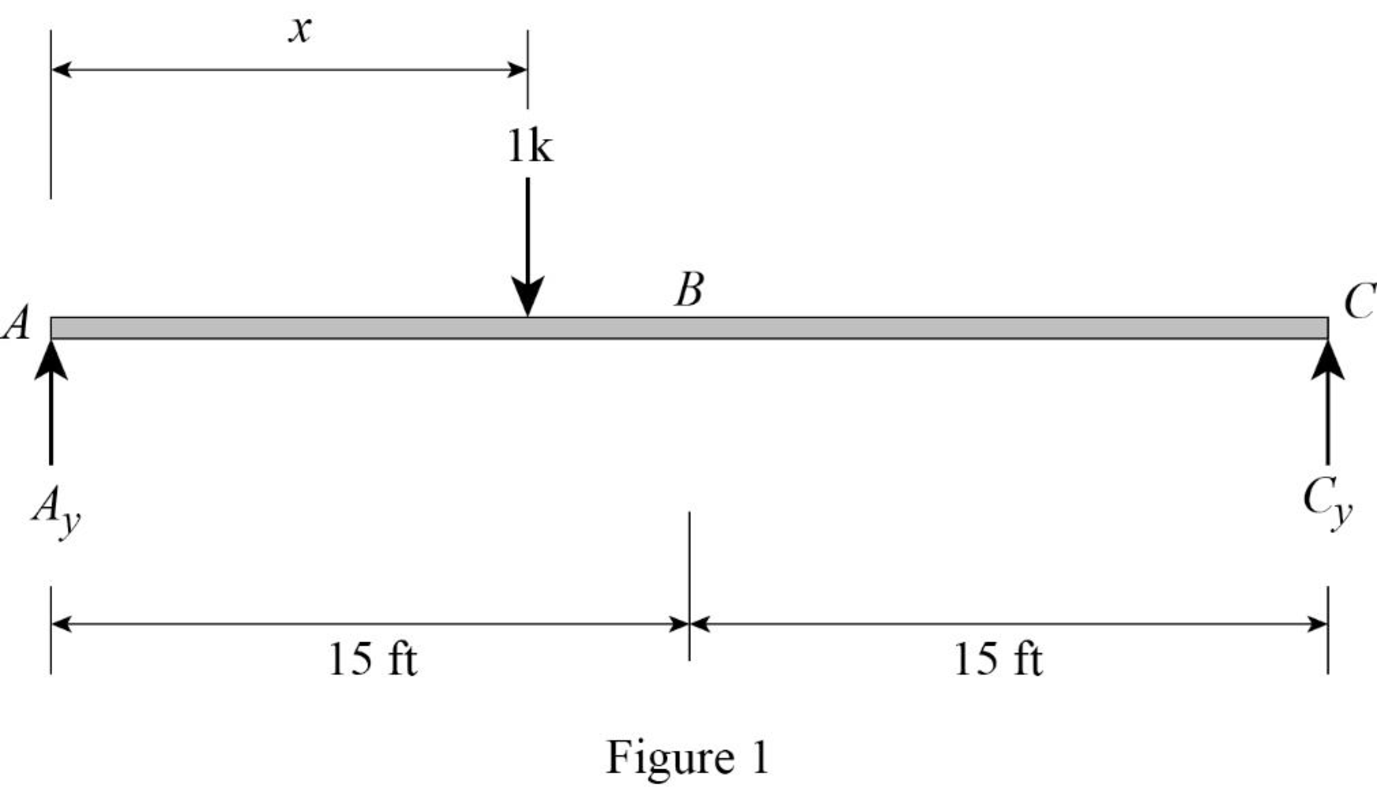
Refer Figure 1.
Find the equation of support reaction
Take moment about point C.
Consider moment equilibrium at point C.
Consider clockwise moment as positive and anticlockwise moment as negative
Sum of moment at point C is zero.
Find the equation of support reaction
Apply vertical equilibrium equation of forces.
Consider upward force as positive
Substitute
Consider Equation (1).
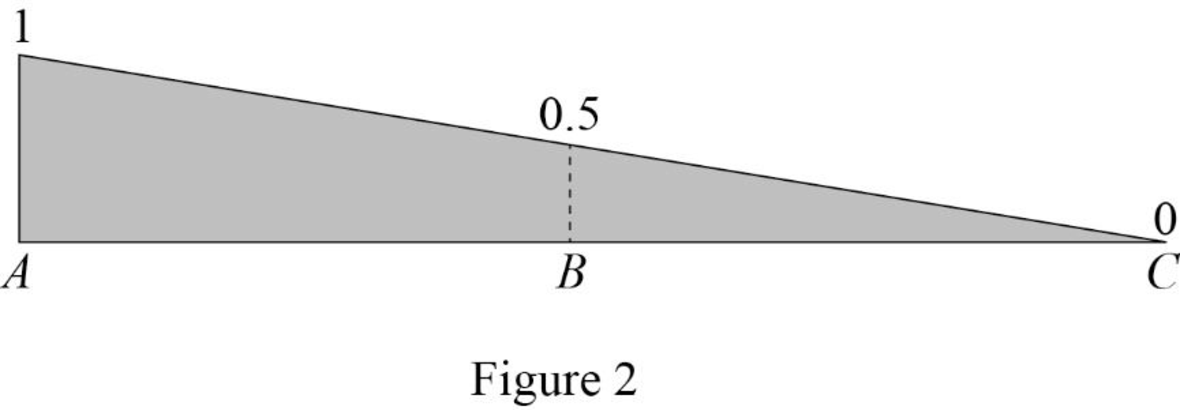
Find the value of influence line ordinate of reaction
Substitute 0 for x in Equation (1).
Similarly calculate the influence line ordinate of reaction
| x | |
| 0 | 1 |
| 15 | 0.5 |
| 30 | 0 |
Draw the influence line diagram for the vertical reactions at support A using Table 1 as shown in Figure 2.
Consider Equation (2).
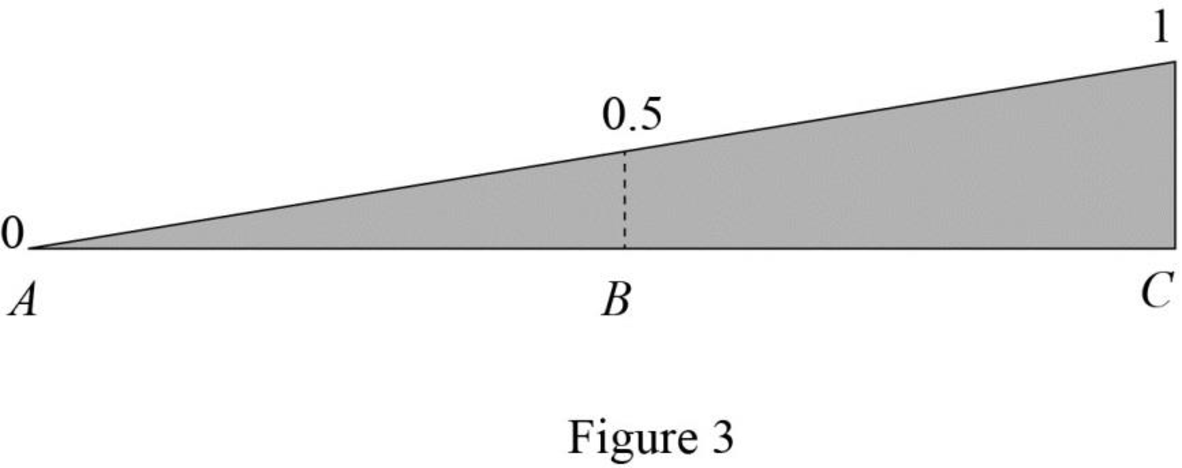
Find the influence line ordinate of reaction
Substitute 30 for x in Equation (2).
Similarly calculate the influence line ordinate of reaction
| x | |
| 0 | 0 |
| 15 | 0.5 |
| 30 | 1 |
Draw the influence line diagram for the vertical reactions at support C using Table 2 as shown in Figure 3.
Find the equation of shear force at B of portion AB
Sketch the free body diagram of the section AB as shown in Figure 4.
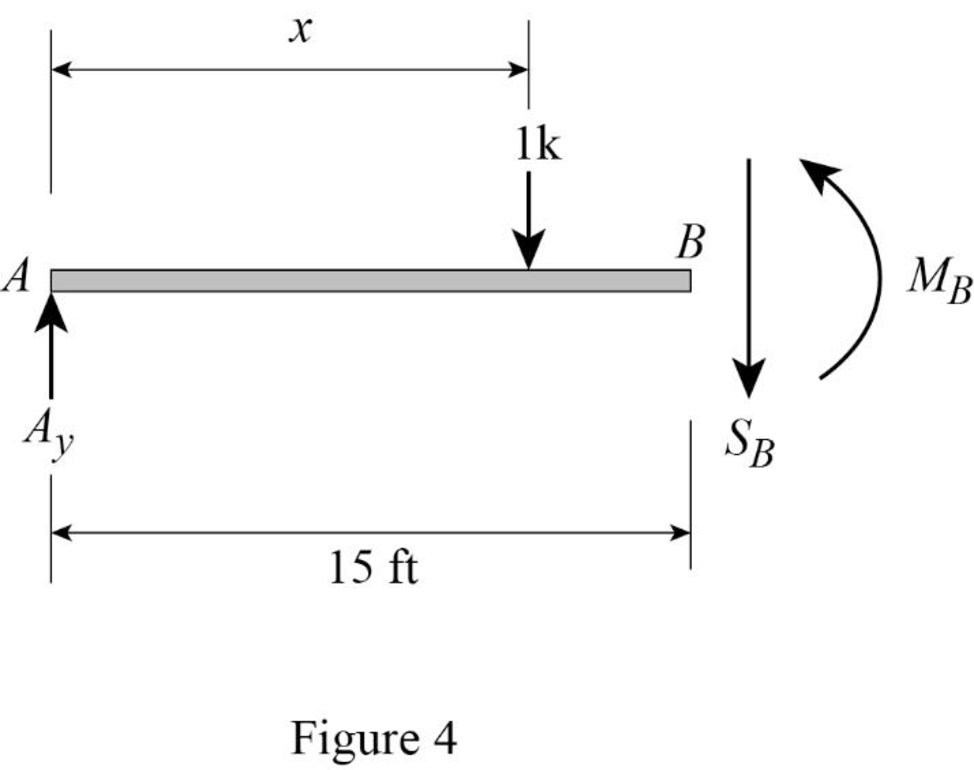
Refer Figure 4.
Apply equilibrium equation of forces.
Consider upward force as positive
Substitute
Find the equation of shear force at B of portion BC
Sketch the free body diagram of the section BC as shown in Figure 5.
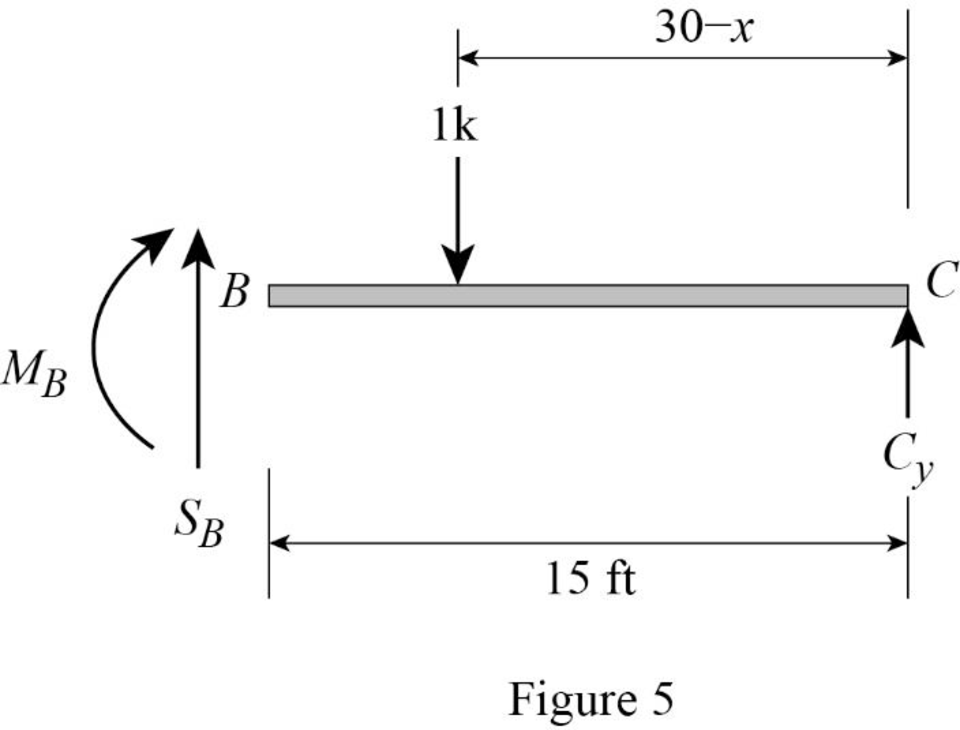
Refer Figure 5.
Apply equilibrium equation of forces.
Consider upward force as positive
Substitute
Thus, the equations of the influence line for
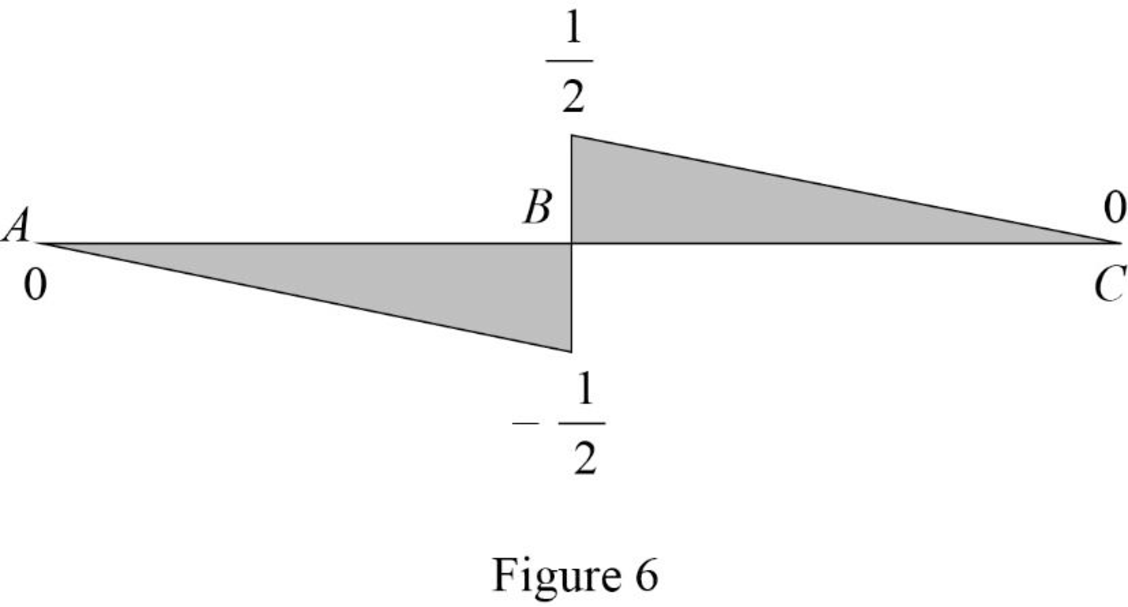
Find the value of influence line ordinate of shear force at various points of x using the Equations (3) and (4) and summarize the value as in Table 3.
| x | |
| 0 | 1 |
| 30 | 0 |
Draw the influence lines for the shear force at point B using Table 3 as shown in Figure 6.
Refer Figure 4.
Consider clockwise moment as positive and anticlockwise moment as negative.
Find the equation of moment at B of portion AB
Substitute
Refer Figure 5.
Consider clockwise moment as negative and anticlockwise moment as positive.
Find the equation of moment at B of portion BC
Substitute
Thus, the equations of the influence line for
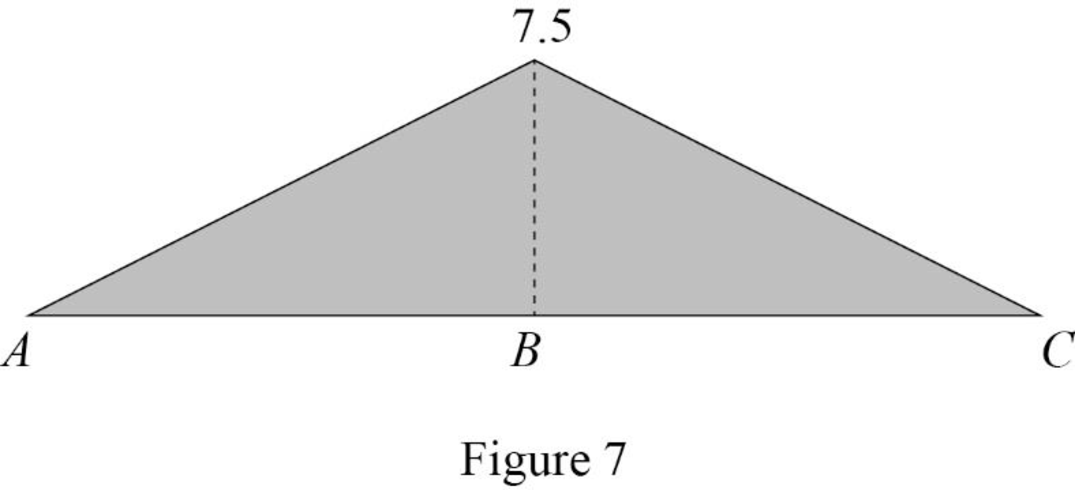
Find the value of influence line ordinate of moment at various points of x using the Equations (5) and (6) and summarize the value as in Table 4.
| x | |
| 0 | 0 |
| 30 | 0 |
Draw the influence lines for the moment at point B using Table 4 as shown in Figure 7.
Therefore, the influence lines for the vertical reactions at supports A and C and the influence lines for the shear and bending moment at point B are drawn.
Want to see more full solutions like this?
Chapter 8 Solutions
Structural Analysis, Si Edition (mindtap Course List)


- 1. (20 Points) Determine the critical depth in the trapezoidal drainage ditch shown below. The slope of the ditch is 0.0016, the side slopes are 1V:2.5H, the bottom width is b = 14', and the design discharge is 500 cfs. At this discharge the depth is y = 4.25'. Also, determine the flow regime and calculate the Froude number. Ye= ? Z barrow_forward3. (20 Points) A broad crested weir, 10 feet high, will be constructed in a rectangular channel B feet wide. The weir crest extends a length of B = 120 feet between the banks with 2 - 4 foot wide, round nosed piers in the channel. The width of the weir crest is 8 feet. If H = 6', determine the design discharge for the weir.arrow_forwardParking Needs vs. Alternative Transportation Methods for presentation slides include images and graphsarrow_forward
- Please explain step by step and show formulararrow_forwardBeam ABD is supported and loaded as shown. The cross-section of the beam is also shown. The modulus of elasticity of the beam is 200 GPa. 6.0 kN/m Cross-section: 330 mm 4.5 kN 8.0 kNm 40 mm 2.5 m 1.5 m 20 mm Set up the discontinuity moment function in terms of x. List all the appropriate boundary conditions. Determine the slope function in terms of x. Determine the deflection function in terms of x. Determine the support reactions. Determine the maximum deflection. 290 mmarrow_forwardDraw the Shear Force Diagram and Bending Moment Diagram for the beam shown in Fig.1. The beam is subjected to an UDL of w=65m. L=4.5m L1= 1.8m. Assume the support at C is pinned, and A and B are roller supports. E = 200GPa, I = 250x106 mm4.arrow_forward
- Calculate the BMs (bending moments) at all the joints of the beam shown in Fig.1 using the Slope Deflection method. The beam is subjected to an UDL of w=65m. L=4.5m L1= 1.8m. Assume the support at C is pinned, and A and B are roller supports. E = 200GPa, I = 250x106 mm4.arrow_forwardText Book Problem 7.82 (page 261) Consider the total head-loss in the system forthis flow is 18.56 ft (head-losses in first and second pipe are 13.83 ft and 4.73 ftrespectively). Please show numerical values for EGL/HGL at the beginning/end/intermediatechange point. (Point distribution: elevation determination 5 points, EGL, HGL lines 4points).(I think we are just using the values provided for head losses to solve this problem)arrow_forwardCalculate the BMs (bending moments) at all the joints of the beam shown in Fig.1 using the moment distribution method, and draw the Shear force diagram and Bending moment diagram for the beam shown. The beam is subjected to an UDL of w=65m. L=4.5m L1= 1.8m. Assume the support at C is pinned, and A and B are roller supports. E = 200GPa, I = 250x106 mm4.arrow_forward
- Calculate the BMs (bending moments) at all the joints of the beam shown in Fig.1 using the Slope deflection method. The beam is subjected to an UDL of w=65m. L=4.5m L1= 1.8m. Assume the support at C is pinned, and A and B are roller supports. E = 200GPa, I = 250x106 mm4.arrow_forwardThank you for your help if you would also provide the equations used .arrow_forwardThe sectors are divided as follows:top right = 1, top left = 2, middle = 3, bottom = 4.(a) Determine the distance yˉ to the centroid of the beam’s cross-sectional area.Solve the next questions by building a table. (Table format Answers) (b) Determine the second moment of area (moment of inertia) about the x′ axis. (c) Determine the second moment of area (moment of inertia) about the y-axis.arrow_forward
