
Concept explainers
Draw the influence lines for the vertical reactions at supports A and C.
Draw the influence lines for the shear and bending moment at point B.
Explanation of Solution
Calculation:
Apply a 1 k unit moving load at a distance of x from left end A.
Sketch the free body diagram of beam as shown in Figure 1.
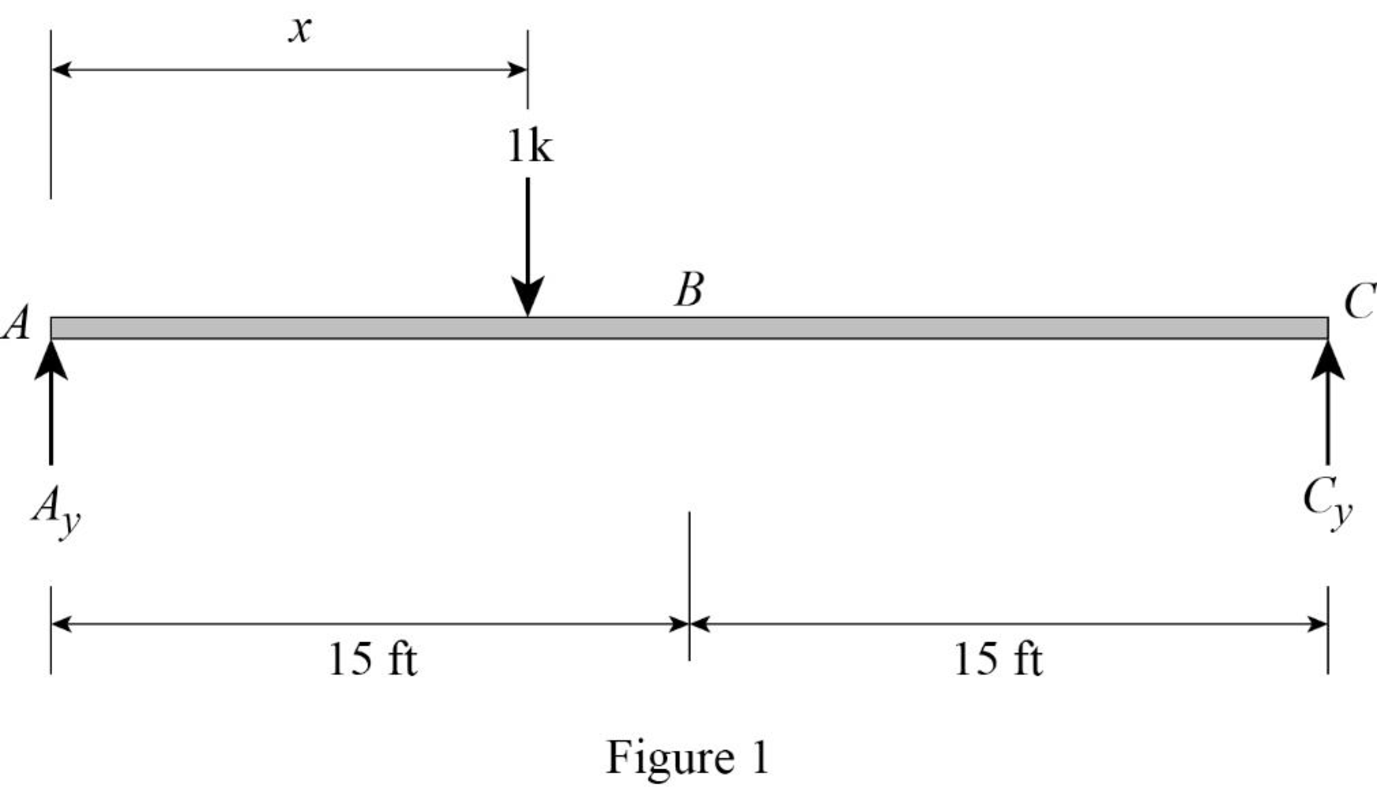
Refer Figure 1.
Find the equation of support reaction
Take moment about point C.
Consider moment equilibrium at point C.
Consider clockwise moment as positive and anticlockwise moment as negative
Sum of moment at point C is zero.
Find the equation of support reaction
Apply vertical equilibrium equation of forces.
Consider upward force as positive
Substitute
Consider Equation (1).
Find the value of influence line ordinate of reaction
Substitute 0 for x in Equation (1).
Similarly calculate the influence line ordinate of reaction
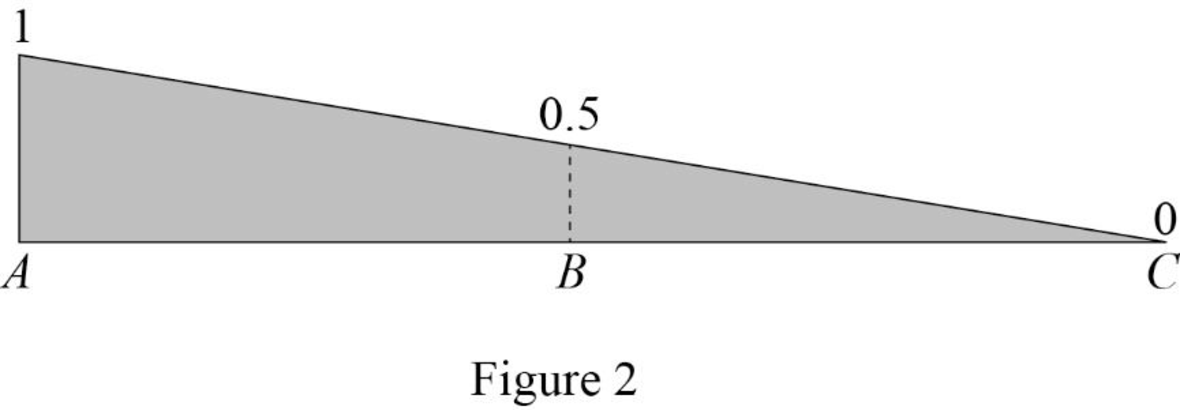
| x | |
| 0 | 1 |
| 15 | 0.5 |
| 30 | 0 |
Draw the influence line diagram for the vertical reactions at support A using Table 1 as shown in Figure 2.
Consider Equation (2).
Find the influence line ordinate of reaction
Substitute 30 for x in Equation (2).
Similarly calculate the influence line ordinate of reaction
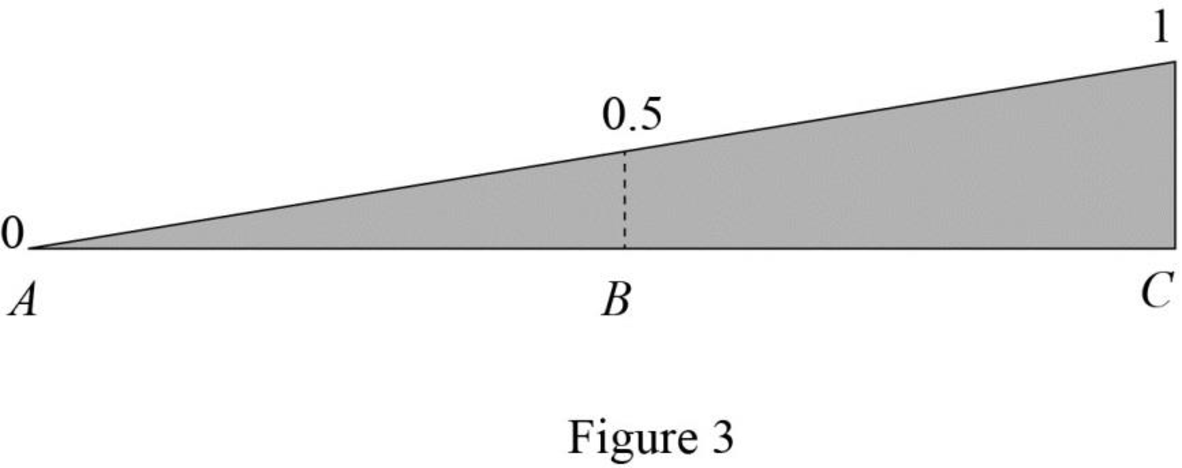
| x | |
| 0 | 0 |
| 15 | 0.5 |
| 30 | 1 |
Draw the influence line diagram for the vertical reactions at support C using Table 2 as shown in Figure 3.
Find the equation of shear force at B of portion AB
Sketch the free body diagram of the section AB as shown in Figure 4.
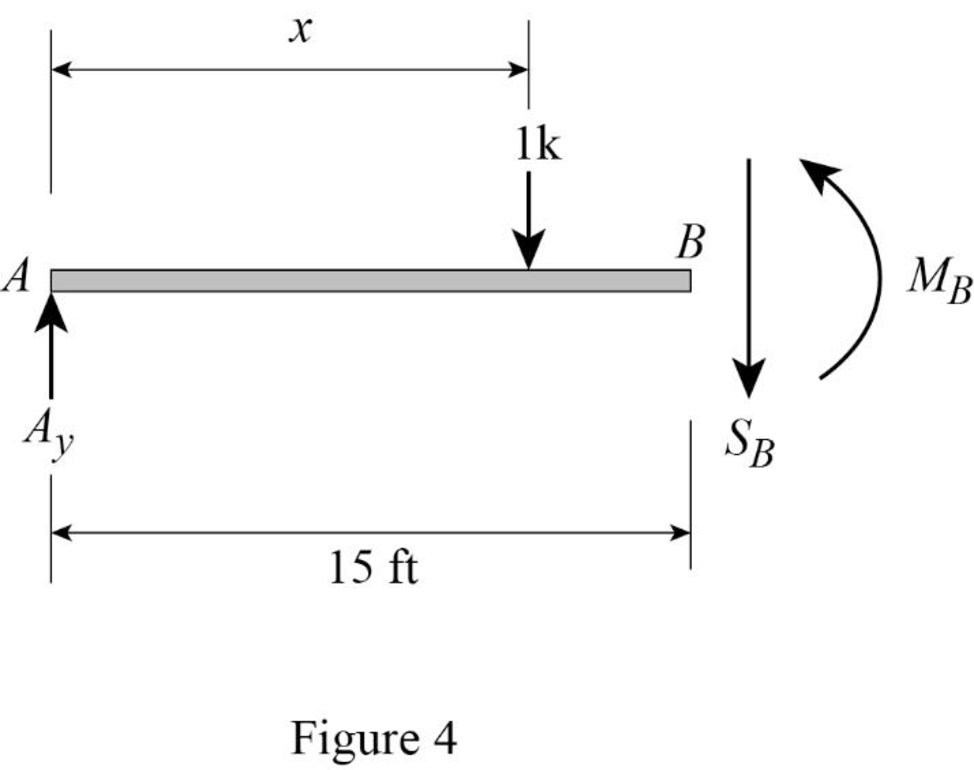
Refer Figure 4.
Apply equilibrium equation of forces.
Consider upward force as positive
Substitute
Find the equation of shear force at B of portion BC
Sketch the free body diagram of the section BC as shown in Figure 5.
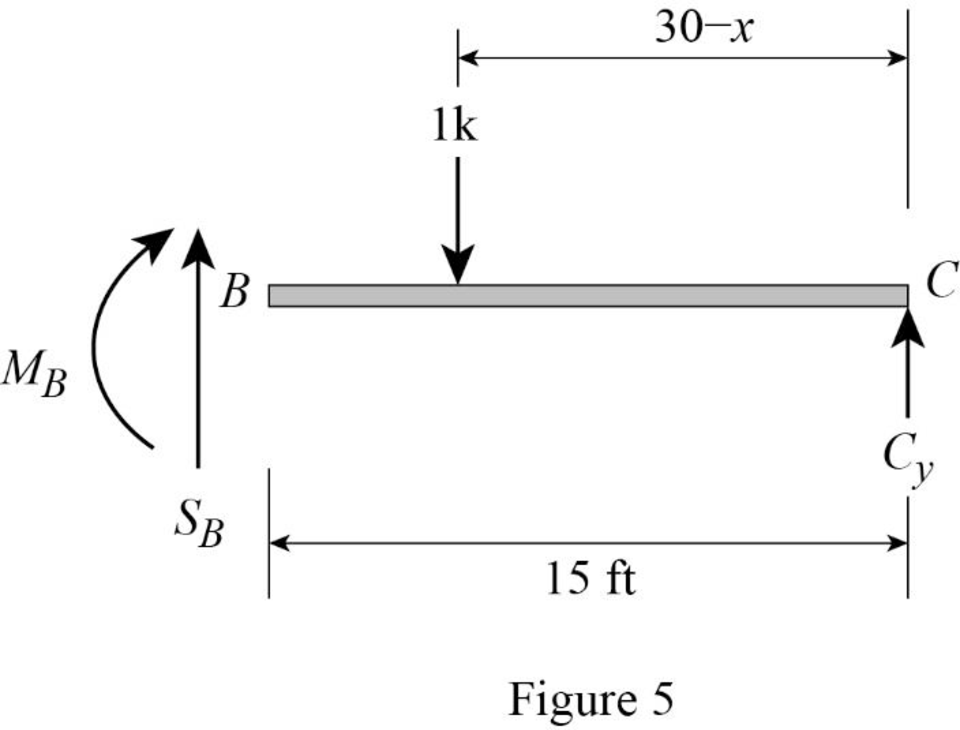
Refer Figure 5.
Apply equilibrium equation of forces.
Consider upward force as positive
Substitute
Thus, the equations of the influence line for
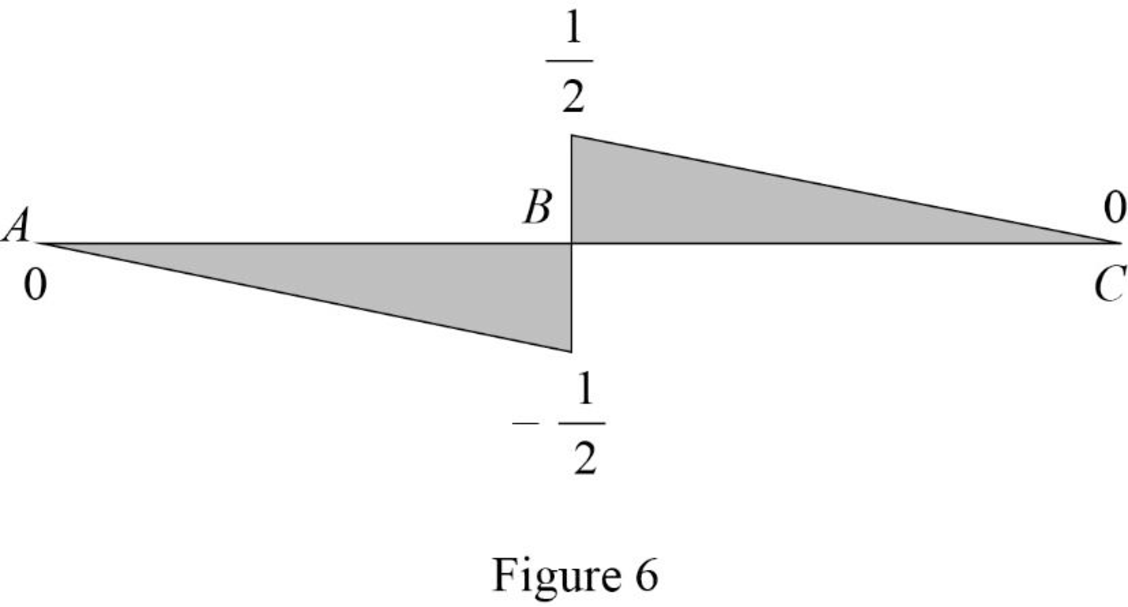
Find the value of influence line ordinate of shear force at various points of x using the Equations (3) and (4) and summarize the value as in Table 3.
| x | |
| 0 | 1 |
| 30 | 0 |
Draw the influence lines for the shear force at point B using Table 3 as shown in Figure 6.
Refer Figure 4.
Consider clockwise moment as positive and anticlockwise moment as negative.
Find the equation of moment at B of portion AB
Substitute
Refer Figure 5.
Consider clockwise moment as negative and anticlockwise moment as positive.
Find the equation of moment at B of portion BC
Substitute
Thus, the equations of the influence line for
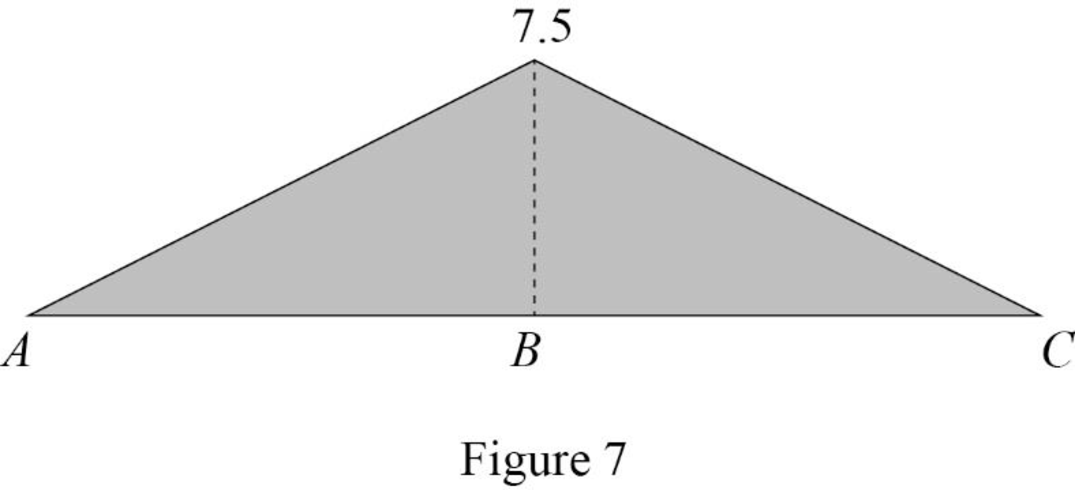
Find the value of influence line ordinate of moment at various points of x using the Equations (5) and (6) and summarize the value as in Table 4.
| x | |
| 0 | 0 |
| 30 | 0 |
Draw the influence lines for the moment at point B using Table 4 as shown in Figure 7.
Therefore, the influence lines for the vertical reactions at supports A and C and the influence lines for the shear and bending moment at point B are drawn.
Want to see more full solutions like this?
Chapter 8 Solutions
EBK STRUCTURAL ANALYSIS


- In testing a certain kind or truck tire over rugged terrain, it is found that 20% of the trucks fail to complete the test run without a blowout. Of the next 13 trucks tested, find the probability that (a) from 2 to 6 have blowouts, (b) fewer than 4 have blowouts, and (c) more than 5 have blowouts. Click here to view page 1 of the table of binomial probability sums. Click here to view page 2 of the table of binomial probability sums. (a) The probability that from 2 to 6 trucks have blowouts is (Round to four decimal places as needed.)arrow_forwardA project requires 125 cubic yards of concrete sidewalk to be placed, for which 165 workhours have been budgeted. The latest weekly progress report shows that 78 cubic yards have been placed and 103 workhours have been expended to date. What is the status of the concrete placement? Significantly under budget. On budget. Significantly over budget. Status cannot be determined with information supplied.arrow_forwardRefer to exhibit #098. At what depth was water encountered?arrow_forward
- What is the reaction moment at A for the frame shown? a. 222.1 k-ft b. 107.8 k-ft c. 20.8 k-ft d. 23.25 k-ftarrow_forward“When a conflict exists between the project floor plans and detailed material schedule relative to size or number, which of the following usually governs in typical order of precedence?arrow_forwardWhat are the critical activitiesarrow_forward
- Approximately how many pounds of water are necessary to hydrate 100 pounds of type I Portland cement? 30 50 75 94arrow_forward7:05 3.1 Trabajo en clase.pptx .III LTE 8 Trabajo en clases 3.1 C9 X 20 W8 X 21 5-15. PL¹× 12 Fy = 50 klb/plg² KL = 16 pies KL 21 pies 2 plg MC 13 × 50 PL × 12 Fy = 42 klb/plg2 Fy = 36 klb/plg² 8 plg K k MC8 × 21.4 KL = 20 piesarrow_forwardThe steel frameword below is used to support the reinforced concrete slab used for an office area above the first storey. The slab is 210 mm thick. Sketch the loading that acts along members BE and FED. Use a = 2.15 m and b = 5.25 m. Refer to the 2024 OBC live load table. The unit weight for the concrete is 24.15 kN/m3.find:Loading for member BE Loading for member FED Live and Dead Loadsarrow_forward
- For the simply supported beam below, draw both the shear force (VFD) and ending moment (BDM) diagrams. Please show all equations and free body diagrams (FBD). Note: I want a cut through each of the three sections of the beam, with all related forces calculated and shown on the VFD and BMD.Reaction Forces Shear Force DiagramMaximum Shear ForceEquation for cut 1, 2, 3 respectively.Confirmation of Reaction ForcesBending Moment DiagramMaximum Bending Momentarrow_forwardFor the structural frame below, draw the shear force (VFD) and bending moment (BMD) diagrams for each of the three members of the frame. The frame is pin connected at A, C and D and fixed at joint B.Find:VFD & BMD for segment AB VFD & BMD for segment BCVFD & BMD for segment CD Reaction Forces VFD Equations BMD EquationsFree Body Diagramsarrow_forwardDetermine the horizontal and vertical reactions at A and C for the two member frame below. Use P1 = 3.2 kN, P2 = 14.5 kN/m, L1 = 3.3 m, and L2 = 2.3 m. Free Body DiagramsTriangular Load Use of Pin Reaction Forcesarrow_forward
