Using Figure 8-2:
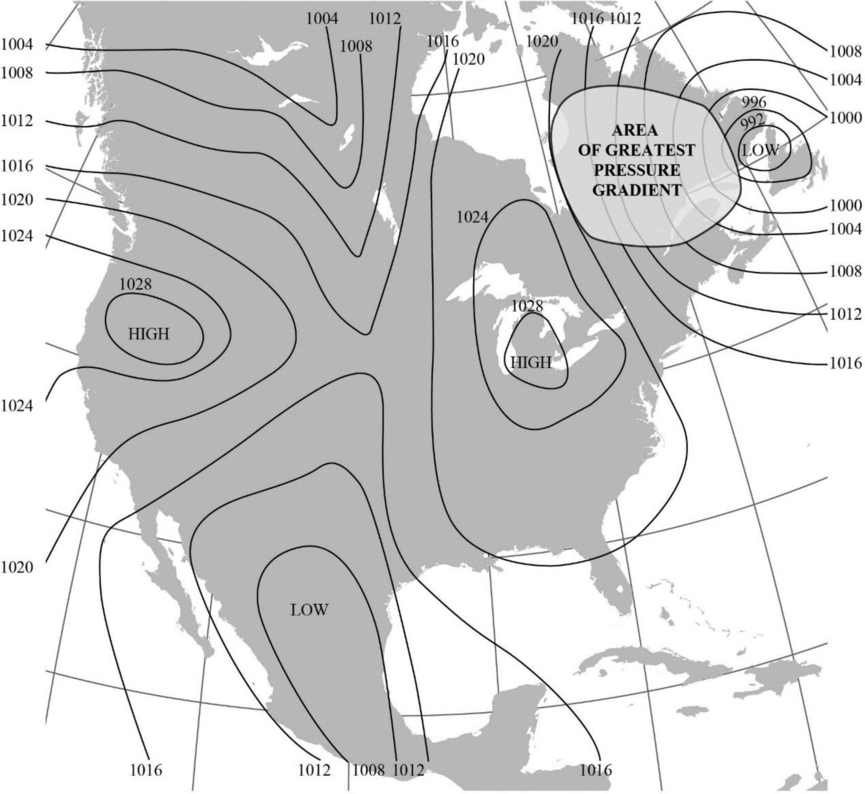
- a. Circle the area with the greatest pressure gradient.
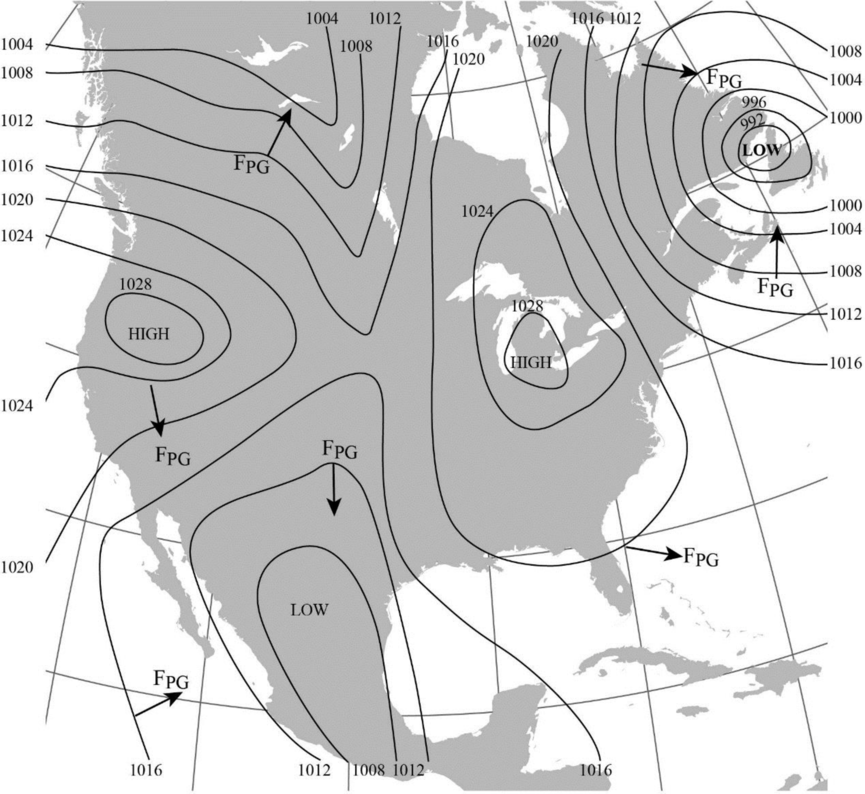
- b. Use arrows to show the direction of pressure gradient force at a few locations. (These are typically drawn perpendicular to isobars.)
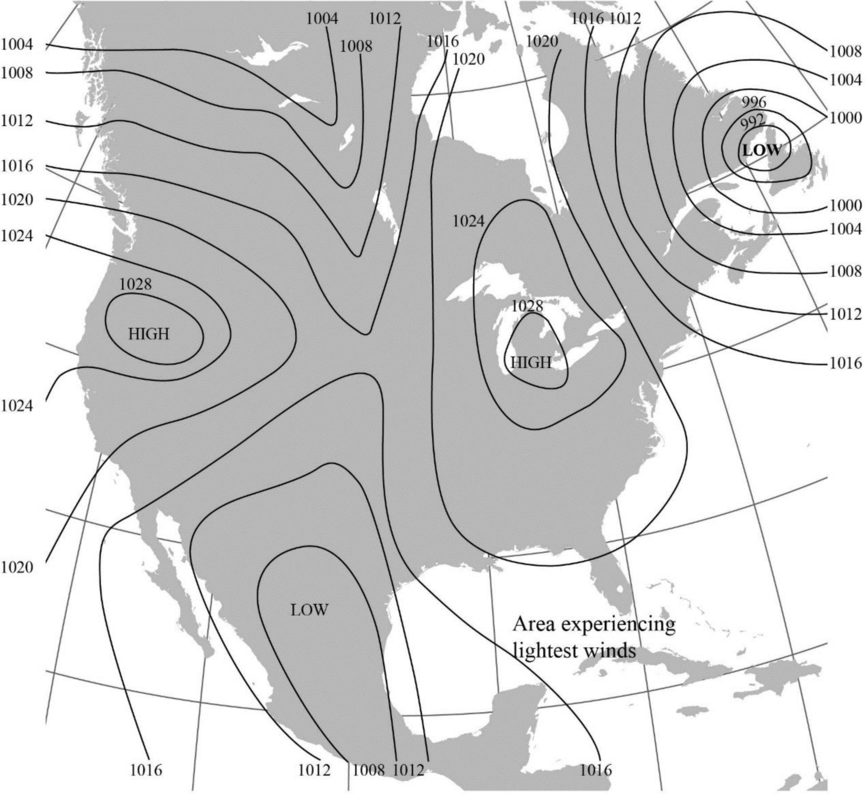
- c. Label a region where you would expect the lightest winds.
(a)
The area with the greatest pressure gradient in Figure 8-2 using circle.
Answer to Problem 1E
The map showing the area with the greatest pressure gradient is given below:
Explanation of Solution
“The magnitude of pressure gradient force is a function of the pressure difference between two points and air density.”
The map given in Figure 8-2 shows isobars, which are lines that connect areas with equal pressure. Closer isobars represent areas with higher pressure gradient. On the basis of this, the greatest pressure gradient is marked using a circle in the map towards the top right side of the Figure.
(b)
The direction of pressure gradient force at some locations in Figure 8-2 using arrows.
Answer to Problem 1E
The map with the direction of pressure gradient force at some locations indicated using arrows is shown below:
Explanation of Solution
The direction of pressure gradient force is usually drawn perpendicular to the isobars. The pressure gradient force is generally directed from the region of high pressure to lower pressure.
(c)
The region where the lightest winds are expected to occur in Figure 8-2.
Answer to Problem 1E
The area expected to experience the lightest winds is labelled in the map given below:
Explanation of Solution
The isobars that are widely-spaced generally denote a gradual pressure gradient and lighter winds whereas the closely-spaced isobars denote steep pressure gradient and stronger winds.
Want to see more full solutions like this?
Chapter 8 Solutions
Pearson eText for Exercises for Weather & Climate -- Instant Access (Pearson+)
Additional Science Textbook Solutions
Introductory Chemistry (6th Edition)
Campbell Biology in Focus (2nd Edition)
Organic Chemistry (8th Edition)
Campbell Biology (11th Edition)
Microbiology: An Introduction
Chemistry: An Introduction to General, Organic, and Biological Chemistry (13th Edition)

- Distinguish between reserves and resoircesarrow_forwardDescribe what kind of energy source oil ia. Describe 5 advantages of oil as an energy source. Describe 5 disadvantages of oil as energy source. Discuss the future potential of oil as energy source in the United States. Describe how you would convince the residents of the State of Connecticut to utilize more oil as an energy source.arrow_forwardWhat are negative environmental impacts of developing hydroelectric power?arrow_forward
- List 3 energy conservation tecniquesarrow_forward1. Use the elevations in Figure 7.12 as a guide for drawing contour lines. The 100-foot contour line is provided for reference. Using a 20-foot contour interval, draw a contour line for each 20-foot change in elevation below and above 100 feet (e.g., 60 feet, 80 feet, 120 feet). You will have to estimate the elevations between the points. Label each contour line with its elevation. 2. Does the land shown on the topographic map you constructed generally slope downward toward the north or south? 3. Show the direction each stream is flowing by drawing arrows on the map.arrow_forwardDrawing a Topographic Profile Follow the steps illustrated in Figure 7.13 to draw a topographic profile. Use the profile graph in Figure 7.14 to construct a west-east profile along the line A-A' on the contour map you completed in Figure 7.12. Step 1. Our sample profile will be along line A-A. When constructing profiles on maps provided by your instructor, do not draw on the map. Step 2. Lay a piece of paper along the line of the profile you want to construct. In this example this is line A-A'. Mark each place where a contour line intersects the edge of the paper and note the elevation of the contour line. Step 3. On a separate piece of paper, draw a horizontal line slightly longer than your profile line, A-A'. Select a vertical scale for your profile that begins slightly. below the lowest elevation along the profile and extends slightly beyond the highest elevation. Mark this scale on either side of the horizontal line. Lay the marked paper edge (from Step 2) along the horizontal…arrow_forward
- When contour lines cross streams or dry stream channels, they form a V that points upstream. Draw arrows next to three of the streams (shown in blue) to indicate the direction in which each is flowing.arrow_forwardCoal-burning electric power plants in the Pa Midwest have contributed to acid rain in the eastern United States. Other energy sources would most likely be costlier than coal, thereby raising electricity rates. Should citizens in eastern states be able to pressure utility companies in the Midwest to change their method of generating electricity? What mechanisms might be available to make these changes? How effective are these mechanisms?arrow_forwardWhat renewable energy source provides the majority of renewable energy?arrow_forward
 Applications and Investigations in Earth Science ...Earth ScienceISBN:9780134746241Author:Edward J. Tarbuck, Frederick K. Lutgens, Dennis G. TasaPublisher:PEARSON
 Exercises for Weather & Climate (9th Edition)Earth ScienceISBN:9780134041360Author:Greg CarbonePublisher:PEARSON
 Environmental ScienceEarth ScienceISBN:9781260153125Author:William P Cunningham Prof., Mary Ann Cunningham ProfessorPublisher:McGraw-Hill Education
 Earth Science (15th Edition)Earth ScienceISBN:9780134543536Author:Edward J. Tarbuck, Frederick K. Lutgens, Dennis G. TasaPublisher:PEARSON
 Environmental Science (MindTap Course List)Earth ScienceISBN:9781337569613Author:G. Tyler Miller, Scott SpoolmanPublisher:Cengage Learning
 Physical GeologyEarth ScienceISBN:9781259916823Author:Plummer, Charles C., CARLSON, Diane H., Hammersley, LisaPublisher:Mcgraw-hill Education,