Using Figure 8-2:
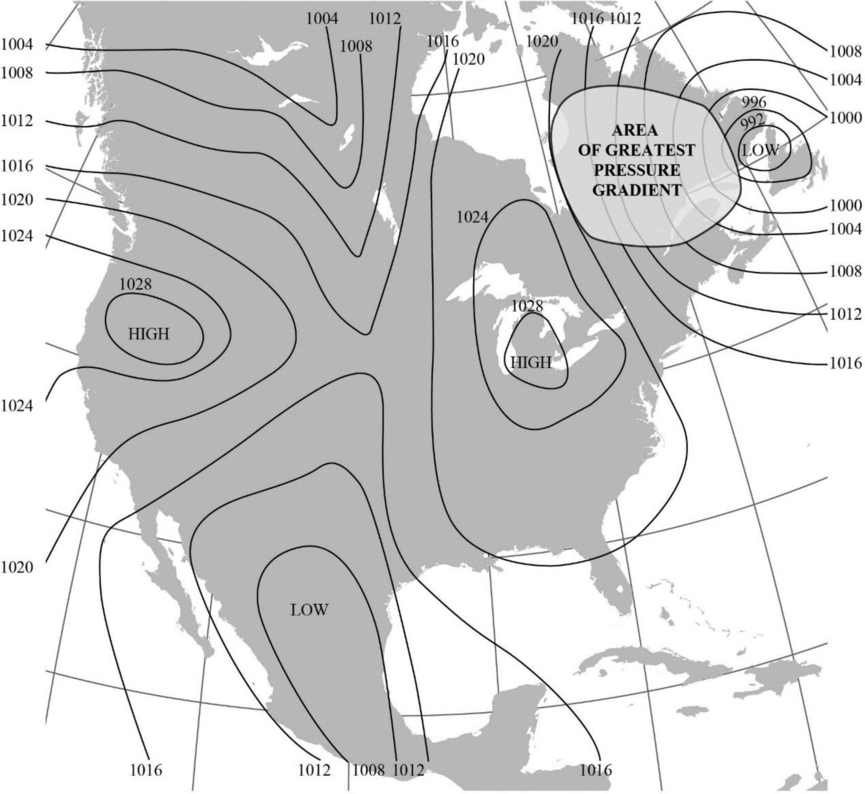
- a. Circle the area with the greatest pressure gradient.
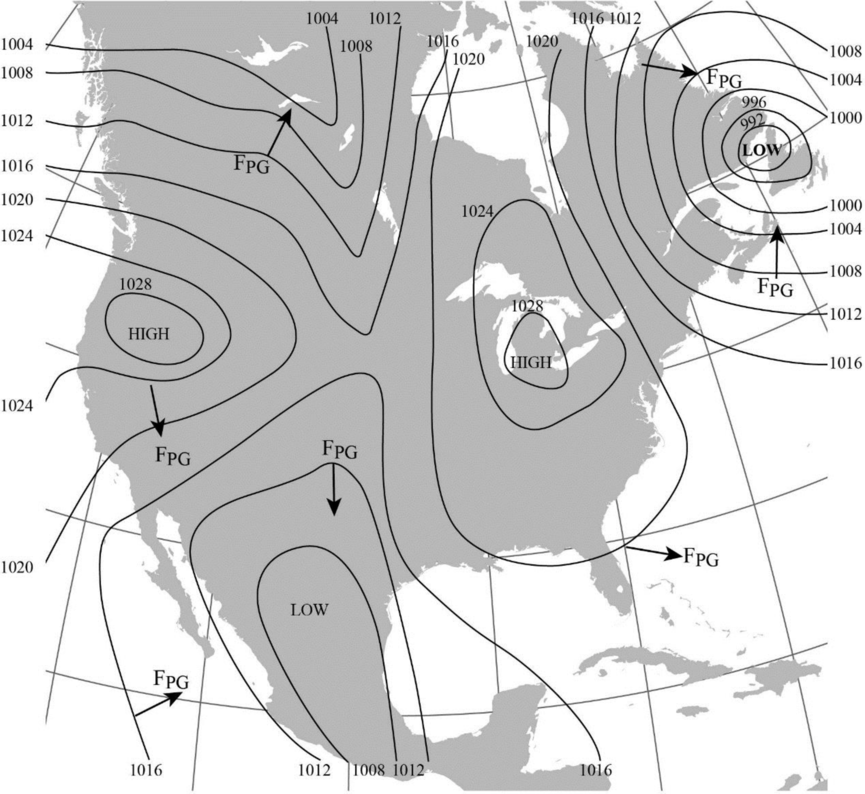
- b. Use arrows to show the direction of pressure gradient force at a few locations. (These are typically drawn perpendicular to isobars.)
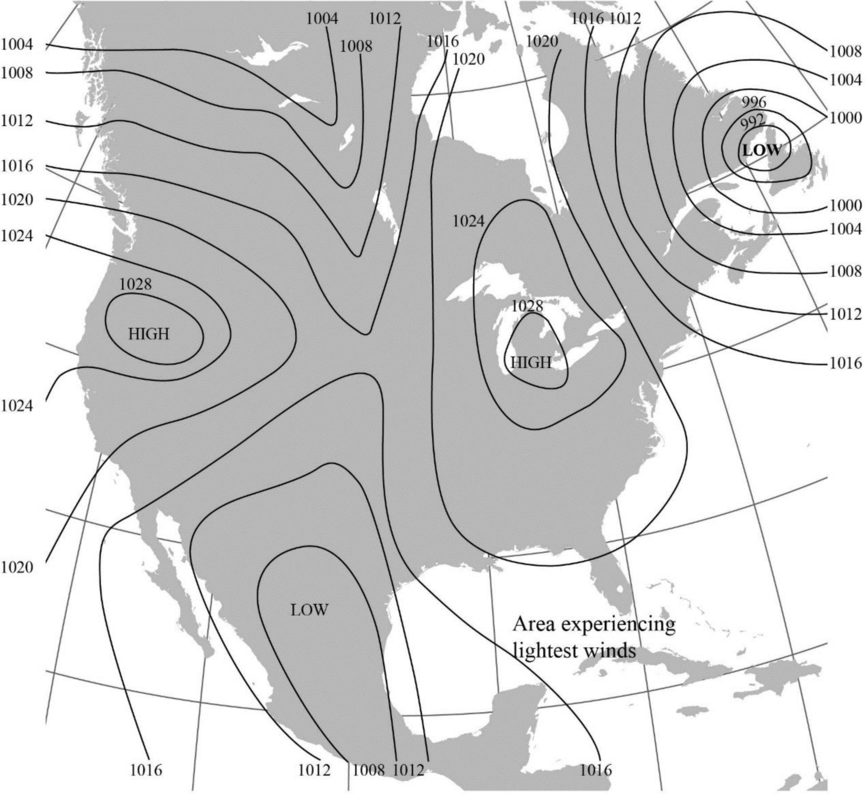
- c. Label a region where you would expect the lightest winds.
(a)
The area with the greatest pressure gradient in Figure 8-2 using circle.
Answer to Problem 1E
The map showing the area with the greatest pressure gradient is given below:
Explanation of Solution
“The magnitude of pressure gradient force is a function of the pressure difference between two points and air density.”
The map given in Figure 8-2 shows isobars, which are lines that connect areas with equal pressure. Closer isobars represent areas with higher pressure gradient. On the basis of this, the greatest pressure gradient is marked using a circle in the map towards the top right side of the Figure.
(b)
The direction of pressure gradient force at some locations in Figure 8-2 using arrows.
Answer to Problem 1E
The map with the direction of pressure gradient force at some locations indicated using arrows is shown below:
Explanation of Solution
The direction of pressure gradient force is usually drawn perpendicular to the isobars. The pressure gradient force is generally directed from the region of high pressure to lower pressure.
(c)
The region where the lightest winds are expected to occur in Figure 8-2.
Answer to Problem 1E
The area expected to experience the lightest winds is labelled in the map given below:
Explanation of Solution
The isobars that are widely-spaced generally denote a gradual pressure gradient and lighter winds whereas the closely-spaced isobars denote steep pressure gradient and stronger winds.
Want to see more full solutions like this?
Chapter 8 Solutions
Exercises for Weather & Climate Plus Mastering Meteorology with eText -- Access Card Package (9th Edition)
Additional Science Textbook Solutions
Introductory Chemistry (6th Edition)
Campbell Biology in Focus (2nd Edition)
Organic Chemistry (8th Edition)
Campbell Biology (11th Edition)
Microbiology: An Introduction
Chemistry: An Introduction to General, Organic, and Biological Chemistry (13th Edition)

- Why is the Atlantic Ocean the saltiest ocean on Earth? In your explanation, use the terms “evaporation,” “precipitation,” “trade winds,” “Central America,” and “Pacific Ocean”.?arrow_forwardAt the large scale of the major ocean basins, do ocean currents tend to flow in a cyclonic or anti-cyclonic direction? How is this evidenced in the map of average sea-surface temperatures belowarrow_forwardThe map below shows sea-surface temperature (SST) anomalies during El Niño years. Please explain what is meant by “anomaly”. In El Niño years, which side (east or west) of the tropical Pacific Ocean experiences anomalously high precipitation totals and which side experiences anomalously low precipitation totals? Why?arrow_forward
- When a body of cold air near earth’s surface moves into a region occupied by warmer air, the point of intersection is known as a cold front. What does this do to the vertical motion of the warm air and why? What does this do to surface pressure ahead of the cold front and why ?Does this tend to instigate cyclonic or anti-cyclonic atmospheric rotation ? Does this rotation tend to bring relatively warm air toward the poles or toward the lower latitudesarrow_forwardAs the atmosphere and ocean move, they are deflected due to the spin of the earth. Is the deflection to the right or to the left in the Northern Hemisphere? Is this the same in the Southern Hemisphere ? In both hemispheres, a low pressure will instigate cyclonic flow. In the Northern Hemisphere, does cyclonic flow circulate in a clockwise or counter-clockwise direction and whyarrow_forwardIs the seasonal cycle in temperature (temperature difference between warmest and coolest season) stronger in the tropics or high latitudes, and why ?How about in “maritime” areas that are regularly exposed to air that was recently over the ocean versus more continental areas, and why?arrow_forward
- The image shows the two different crusts on earth. Fill in the blanks with short answers (numbered as 1,2,3, and 4) for the rock types and the name of the crust. Question 3 options: Blank # 1 Blank # 2 Blank # 3 Blank # 4arrow_forwardyou are working on a crew and you overhear one of the people on the crew tell a member of the general public something that is not true. what do you do?arrow_forwardResearch question ideas for Benthic invertebrates as an indicator species for climate change, mapping changes in ecosystems (Historical Analysis & GIS) use where questionsarrow_forward
- Research question ideas for Benthic invertebrates as an indicator species for climate change, mapping changes in ecosystems (Historical Analysis & GIS) use where questionsarrow_forwardBrief background for supporting of efforts should be made to create distance and separate crops that produce pollutants such as ecoli (i.e. animal farming) from crops that don’t (i.e. lettuce) to protect these latter crops despite the extra costs and logistical challenges.arrow_forwardOpening statement for supporting of efforts should be made to create distance and separate crops that produce pollutants such as ecoli (i.e. animal farming) from crops that don’t (i.e. lettuce) to protect these lattercrops despite the extra costs and logistical challenges.arrow_forward
 Applications and Investigations in Earth Science ...Earth ScienceISBN:9780134746241Author:Edward J. Tarbuck, Frederick K. Lutgens, Dennis G. TasaPublisher:PEARSON
 Exercises for Weather & Climate (9th Edition)Earth ScienceISBN:9780134041360Author:Greg CarbonePublisher:PEARSON
 Environmental ScienceEarth ScienceISBN:9781260153125Author:William P Cunningham Prof., Mary Ann Cunningham ProfessorPublisher:McGraw-Hill Education
 Earth Science (15th Edition)Earth ScienceISBN:9780134543536Author:Edward J. Tarbuck, Frederick K. Lutgens, Dennis G. TasaPublisher:PEARSON
 Environmental Science (MindTap Course List)Earth ScienceISBN:9781337569613Author:G. Tyler Miller, Scott SpoolmanPublisher:Cengage Learning
 Physical GeologyEarth ScienceISBN:9781259916823Author:Plummer, Charles C., CARLSON, Diane H., Hammersley, LisaPublisher:Mcgraw-hill Education,