
Videos
Critical Thinking Challenges
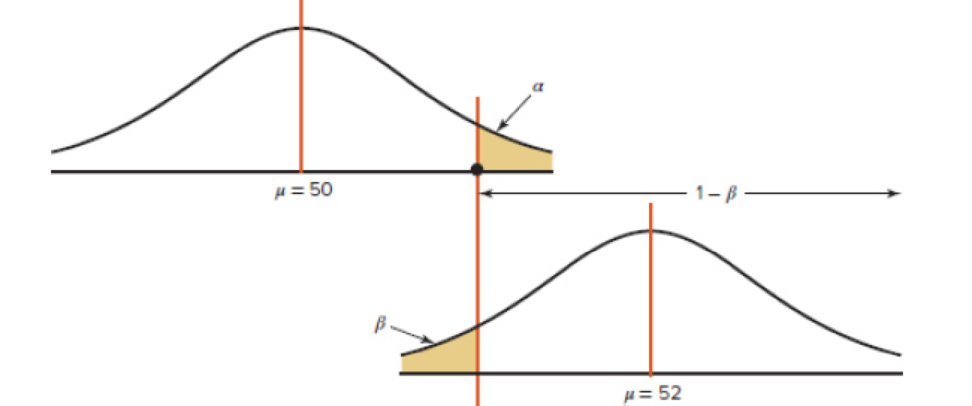
The power of a test (1 − β) can be calculated when a specific value of the
Step 1 For a specific value of α find the corresponding value of
Step 2 Using the value of
Step 3 Subtract this area from 0.5000. This is the value of β.
Step 4 Subtract the value of β from 1. This will give you the power of a test. See Figure 8–41.
1. Find the power of a test, using the hypotheses given previously and α = 0.05, σ = 3, and n = 30.
2. Select several other values for μ in H1 and compute the power of the test. Generalize the results.
FIGURE 8–41 Relationship Among α, β, and the Power of a Test
a.
To obtain: The power of a test, using the given hypotheses and
Answer to Problem 1CTC
The power of test is 0.5222.
Explanation of Solution
Given info:
The hypotheses are
Calculation:
For z score:
Here, the level of significance is 0.05.
The level of significance is 0.05 represents the area of 0.05 to the right of z.
The z score is obtained as follows:
Use Table E: The Standard Normal Distribution to find z score.
Procedure:
- Locate an approximate area of 0.95 in the body of the Table E.
- Move left until the first column and note the values as 1.6.
- Move upward until the top row is reached and note the values as 0.04 and 0.05.
Thus, the z score is 1.645.
For
The formula for finding
Substitute 50 for
For z using alternative hypothesis mean 52:
The formula for finding the z score is,
Substitute 50.901 for
The z score value of –2.01 represents the area to the left of –2.01.
Use Table E: The Standard Normal Distribution to find the area.
Procedure:
- Locate –2.0 in the left column of the table.
- Obtain the value in the corresponding row below 0.01.
That is,
Thus, the area to the left of –2.01 is 0.0222.
For
The value of
Power of a test:
The formula for finding the power of test is,
Substitute 0.4778 for
Thus, the power of test is 0.5222.
b.
To compute: The power of a test for different mean values in alternative hypothesis.
Answer to Problem 1CTC
The power of a test for different mean values in alternative hypothesis is 0.5001.
Explanation of Solution
Given info:
The null hypothesis is
Calculation:
Consider alternative hypothesis
From part (a), the value of
For
For z using alternative hypothesis mean 53:
The formula for finding the z score is,
Substitute 50.901 for
The z score value of –3.83 represents the area to the left of –3.83.
From the Table E, the area of the z score is 0.0001.
That is,
Thus, the area to the left of –3.83 is 0.0001.
For
The value of
Power of a test:
The formula for finding the power of test is,
Substitute 0.4999 for
Thus, the power of test is 0.5001.
For
For z using alternative hypothesis mean 54:
The formula for finding the z score is,
Substitute 50.901 for
The z score value of 3.47 represents the area to the left of 3.47.
From the Table E, the area of the z score is 0.0001.
That is,
Thus, the area to the left of –5.66 is 0.0001.
For
The value of
Power of a test:
The formula for finding the power of test is,
Substitute 0.4999 for
Thus, the power of test is 0.5001.
Want to see more full solutions like this?
Chapter 8 Solutions
Connect Plus Statistics Hosted by ALEKS Access Card 52 Weeks for Elementary Statistics: A Step-By-St


- Businessarrow_forwardWhat is the solution and answer to question?arrow_forwardTo: [Boss's Name] From: Nathaniel D Sain Date: 4/5/2025 Subject: Decision Analysis for Business Scenario Introduction to the Business Scenario Our delivery services business has been experiencing steady growth, leading to an increased demand for faster and more efficient deliveries. To meet this demand, we must decide on the best strategy to expand our fleet. The three possible alternatives under consideration are purchasing new delivery vehicles, leasing vehicles, or partnering with third-party drivers. The decision must account for various external factors, including fuel price fluctuations, demand stability, and competition growth, which we categorize as the states of nature. Each alternative presents unique advantages and challenges, and our goal is to select the most viable option using a structured decision-making approach. Alternatives and States of Nature The three alternatives for fleet expansion were chosen based on their cost implications, operational efficiency, and…arrow_forward
- The following ordered data list shows the data speeds for cell phones used by a telephone company at an airport: A. Calculate the Measures of Central Tendency from the ungrouped data list. B. Group the data in an appropriate frequency table. C. Calculate the Measures of Central Tendency using the table in point B. 0.8 1.4 1.8 1.9 3.2 3.6 4.5 4.5 4.6 6.2 6.5 7.7 7.9 9.9 10.2 10.3 10.9 11.1 11.1 11.6 11.8 12.0 13.1 13.5 13.7 14.1 14.2 14.7 15.0 15.1 15.5 15.8 16.0 17.5 18.2 20.2 21.1 21.5 22.2 22.4 23.1 24.5 25.7 28.5 34.6 38.5 43.0 55.6 71.3 77.8arrow_forwardII Consider the following data matrix X: X1 X2 0.5 0.4 0.2 0.5 0.5 0.5 10.3 10 10.1 10.4 10.1 10.5 What will the resulting clusters be when using the k-Means method with k = 2. In your own words, explain why this result is indeed expected, i.e. why this clustering minimises the ESS map.arrow_forwardwhy the answer is 3 and 10?arrow_forward
- PS 9 Two films are shown on screen A and screen B at a cinema each evening. The numbers of people viewing the films on 12 consecutive evenings are shown in the back-to-back stem-and-leaf diagram. Screen A (12) Screen B (12) 8 037 34 7 6 4 0 534 74 1645678 92 71689 Key: 116|4 represents 61 viewers for A and 64 viewers for B A second stem-and-leaf diagram (with rows of the same width as the previous diagram) is drawn showing the total number of people viewing films at the cinema on each of these 12 evenings. Find the least and greatest possible number of rows that this second diagram could have. TIP On the evening when 30 people viewed films on screen A, there could have been as few as 37 or as many as 79 people viewing films on screen B.arrow_forwardQ.2.4 There are twelve (12) teams participating in a pub quiz. What is the probability of correctly predicting the top three teams at the end of the competition, in the correct order? Give your final answer as a fraction in its simplest form.arrow_forwardThe table below indicates the number of years of experience of a sample of employees who work on a particular production line and the corresponding number of units of a good that each employee produced last month. Years of Experience (x) Number of Goods (y) 11 63 5 57 1 48 4 54 5 45 3 51 Q.1.1 By completing the table below and then applying the relevant formulae, determine the line of best fit for this bivariate data set. Do NOT change the units for the variables. X y X2 xy Ex= Ey= EX2 EXY= Q.1.2 Estimate the number of units of the good that would have been produced last month by an employee with 8 years of experience. Q.1.3 Using your calculator, determine the coefficient of correlation for the data set. Interpret your answer. Q.1.4 Compute the coefficient of determination for the data set. Interpret your answer.arrow_forward
 Glencoe Algebra 1, Student Edition, 9780079039897...AlgebraISBN:9780079039897Author:CarterPublisher:McGraw Hill
 Mathematics For Machine TechnologyAdvanced MathISBN:9781337798310Author:Peterson, John.Publisher:Cengage Learning,
 College AlgebraAlgebraISBN:9781305115545Author:James Stewart, Lothar Redlin, Saleem WatsonPublisher:Cengage Learning
 Algebra and Trigonometry (MindTap Course List)AlgebraISBN:9781305071742Author:James Stewart, Lothar Redlin, Saleem WatsonPublisher:Cengage Learning
 Functions and Change: A Modeling Approach to Coll...AlgebraISBN:9781337111348Author:Bruce Crauder, Benny Evans, Alan NoellPublisher:Cengage Learning
 Linear Algebra: A Modern IntroductionAlgebraISBN:9781285463247Author:David PoolePublisher:Cengage Learning