Videos
Regression Line
Program plan:
- Import the header file.
- Define the “graphWin” method
- Create a window
- Set the coords
- Display the message on the window
- Call the “draw” method for set the point
- Call the “Line” method for draw the line
- Call the “draw” method for set the point
- Call the “Line” method for draw the line
- Call the “draw” method
- Call the “Rectangle” method
- Get the center position
- Set the “Done” text
- Call the “draw” method stop the program after clicking the “Done” text
- Accept the input from the user
- Set the list
- Make the condition true
- Get the mouse action
- Check the condition
- Break the loop
- Otherwise, store user points in an appended list
- Call the “draw” method
- Return the result
- Define the “average” method
- Set the values for the variables
- Iterate “i” until it reaches “allPoints” value
- Get the “x” and “y” value
- Calculate “sumX”, and “sumY”
- Increment the “count” value
- Calculate the “sumXiYi, “sqX”, “sumSqXi”, “SqY”, and sumSqYi” values
- Calculate the “a” and “b” values
- Return the values
- Define “main” method
- Display the text on the window
- Call the “average” method
- Set the values
- Call the “Line” method
- Call the “draw” method
- Get the mouse action
- Call the function “main()”.
Explanation of Solution
Program:
#import the required header files
from graphics import *
import math as m
#definition of "graphWin" method
def graphWin(Title):
#Create a graphics window
win = GraphWin(Title, 400, 400)
#set the coords
win.setCoords(-10, -10, 10, 10)
#tell user to select multiple locations on the screen to designate points
message = Text(Point(-3, 8), "Click to delineate points on the graph.")
#draw the point
message.draw(win)
#call the "Line" method
axisX = Line(Point(-10,0), Point(10,0))
#call the "draw" method
axisX.draw(win)
#call the "Line" method
axisY = Line(Point(0,10), Point(0,-10))
#call the "draw" method
axisY.draw(win)
#call the "Rectangle" method
r = Rectangle(Point(-9, -9), Point(-7,-8))
#call the "draw" method
r.draw(win)
#get the centre position
rCenter = r.getCenter()
#set the text
stopMouse = Text(rCenter, "Done")
#call the "draw" method
stopMouse.draw(win)
#accept input from user until <done> button is pressed
click = Point(0,0)
#set the list
allPoints = []
#check the condition
while True:
#get the mouse action
click = win.getMouse()
#check the condition
if ((-9 <= click.getX() <= -7) and (-9 <= click.getY() <= -8)):
#break the loop
break
#otherwise
else:
#store user points in an appended list
allPoints.append(click)
#call the "draw" method
click.draw(win)
#return the values
return allPoints, win
#definition of "average" method
def average(allPoints):
#set the values for the variables
sumX = 0
sumY = 0
count = 0
sumXiYi = 0
sumSqXi = 0
sumSqYi = 0
#iterate "i" until it reaches "allPoints" value
for i in allPoints:
#get the "x" and "y" value
x = i.getX()
y = i.getY()
#calculate the "sumX" value
sumX = sumX + x
#calculate the "sumY" value
sumY = sumY + y
#increment the value
count = count + 1
#calculate the "xy" value
xy = x * y
#calculate the "sumXiYi" value
sumXiYi = sumXiYi + xy
#calculate the "SqX" value
SqX = x * x
#calculate the "sumSqXi" value
sumSqXi = sumSqXi + SqX
#calculate the "SqY" value
SqY = y * y
#calculate the "sumSqYi" value
sumSqYi = sumSqYi + SqY
#calculate the "a" and "b" value
a = ((sumY * sumSqXi) - (sumX * sumXiYi)) / (count * (sumSqXi) - sumX ** 2)
b = ((count * sumXiYi) - (sumX * sumY)) / (count * (sumSqXi) - sumX ** 2)
#return the values
return a, b
#definition of "main" method
def main():
#get the text for the window
allPoints, win = graphWin("Regression Line")
#call the method
a, b = average(allPoints)
#set the values
x1 = -10
x2 = 10
#call the "Line" method
regressLine = Line(Point(x1, (a + b * x1)), Point(x2, (a + b * x2)))
#call the "draw" method
regressLine.draw(win)
#get the mouse action
win.getMouse()
#call the "main" method
main()
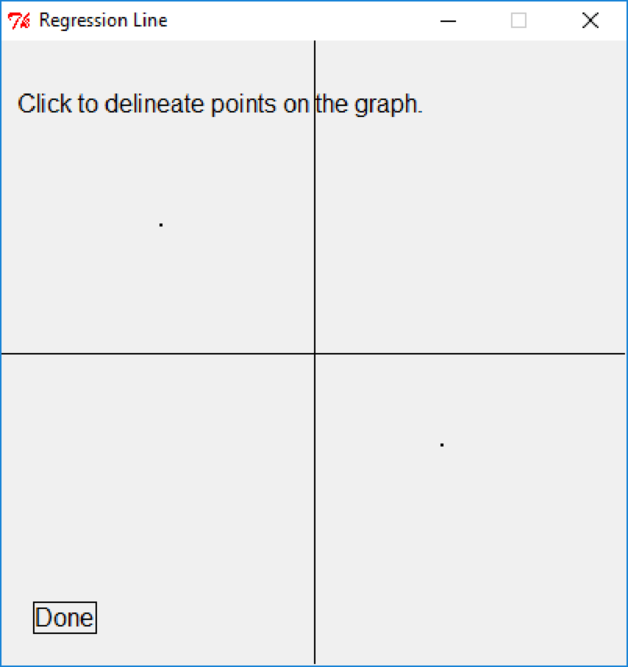
Output:
Screenshot of “Regression Line” window
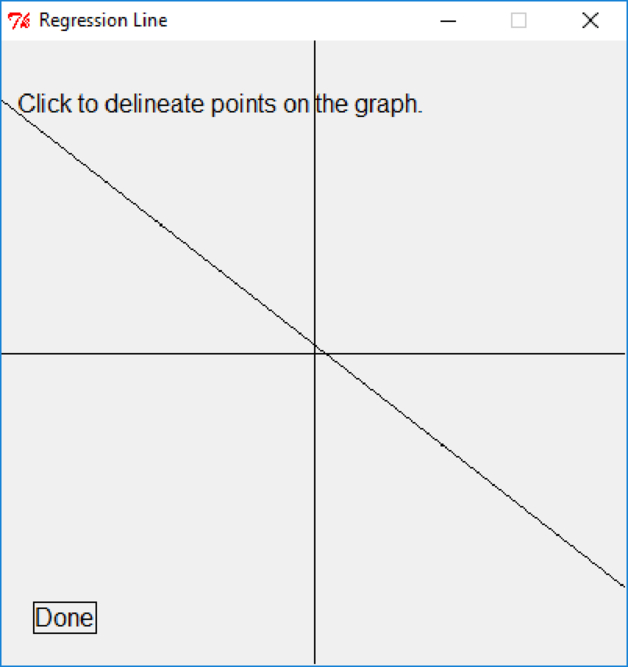
After clicking “Done” button, the below window will appear
Screenshot of “Regression Line” window
Want to see more full solutions like this?
Chapter 8 Solutions
Python Programming: An Introduction to Computer Science


- using r language Obtain a bootstrap t confidence interval estimate for the correlation statistic in Example 8.2 (law data in bootstrap).arrow_forwardusing r language Compute a jackknife estimate of the bias and the standard error of the correlation statistic in Example 8.2.arrow_forwardusing r languagearrow_forward
- using r languagearrow_forwardThe assignment here is to write an app using a database named CIT321 with a collection named students; we will provide a CSV file of the data. You need to use Vue.js to display 2 pages. You should know that this assignment is similar, all too similar in fact, to the cars4sale2 example in the lecture notes for Vue.js 2. You should study that program first. If you figure out cars4sale2, then program 6 will be extremely straightforward. It is not my intent do drop a ton of new material here in the last few days of class. The database contains 51 documents. The first rows of the CSV file look like this: sid last_name 1 Astaire first_name Humphrey CIT major hrs_attempted gpa_points 10 34 2 Bacall Katharine EET 40 128 3 Bergman Bette EET 42 97 4 Bogart Cary CIT 11 33 5 Brando James WEB 59 183 6 Cagney Marlon CIT 13 40 GPA is calculated as gpa_points divided by hrs_attempted. GPA points would have been arrived at by adding 4 points for each credit hour of A, 3 points for each credit hour of…arrow_forwardI need help to solve the following case, thank youarrow_forward
 EBK JAVA PROGRAMMINGComputer ScienceISBN:9781305480537Author:FARRELLPublisher:CENGAGE LEARNING - CONSIGNMENT
 EBK JAVA PROGRAMMINGComputer ScienceISBN:9781337671385Author:FARRELLPublisher:CENGAGE LEARNING - CONSIGNMENT
 C++ Programming: From Problem Analysis to Program...Computer ScienceISBN:9781337102087Author:D. S. MalikPublisher:Cengage Learning
 Microsoft Visual C#Computer ScienceISBN:9781337102100Author:Joyce, Farrell.Publisher:Cengage Learning,
 C++ for Engineers and ScientistsComputer ScienceISBN:9781133187844Author:Bronson, Gary J.Publisher:Course Technology Ptr
 Programming Logic & Design ComprehensiveComputer ScienceISBN:9781337669405Author:FARRELLPublisher:Cengage