Single Variable Calculus: Early Transcendentals (2nd Edition) - Standalone book
2nd Edition
ISBN: 9780321954237
Author: William L. Briggs, Lyle Cochran, Bernard Gillett
Publisher: PEARSON
expand_more
expand_more
format_list_bulleted
Concept explainers
Videos
Textbook Question
Chapter 7.7, Problem 57E
U.S. oil produced and imported The figure shows the rate at which U.S. oil was produced and imported between 1920 and 2005 in units of millions of barrels per day. The total amount of oil produced or imported is given by the area of the region under the corresponding curve. Be careful with units because both days and years are used in this data set.
- a. Use numerical
integration to estimate the amount of U.S. oil produced between 1940 and 2000. Use the method of your choice and experiment with values of n. - b. Use numerical integration to estimate the amount of oil imported between 1940 and 2000. Use the method of your choice and experiment with values of n.
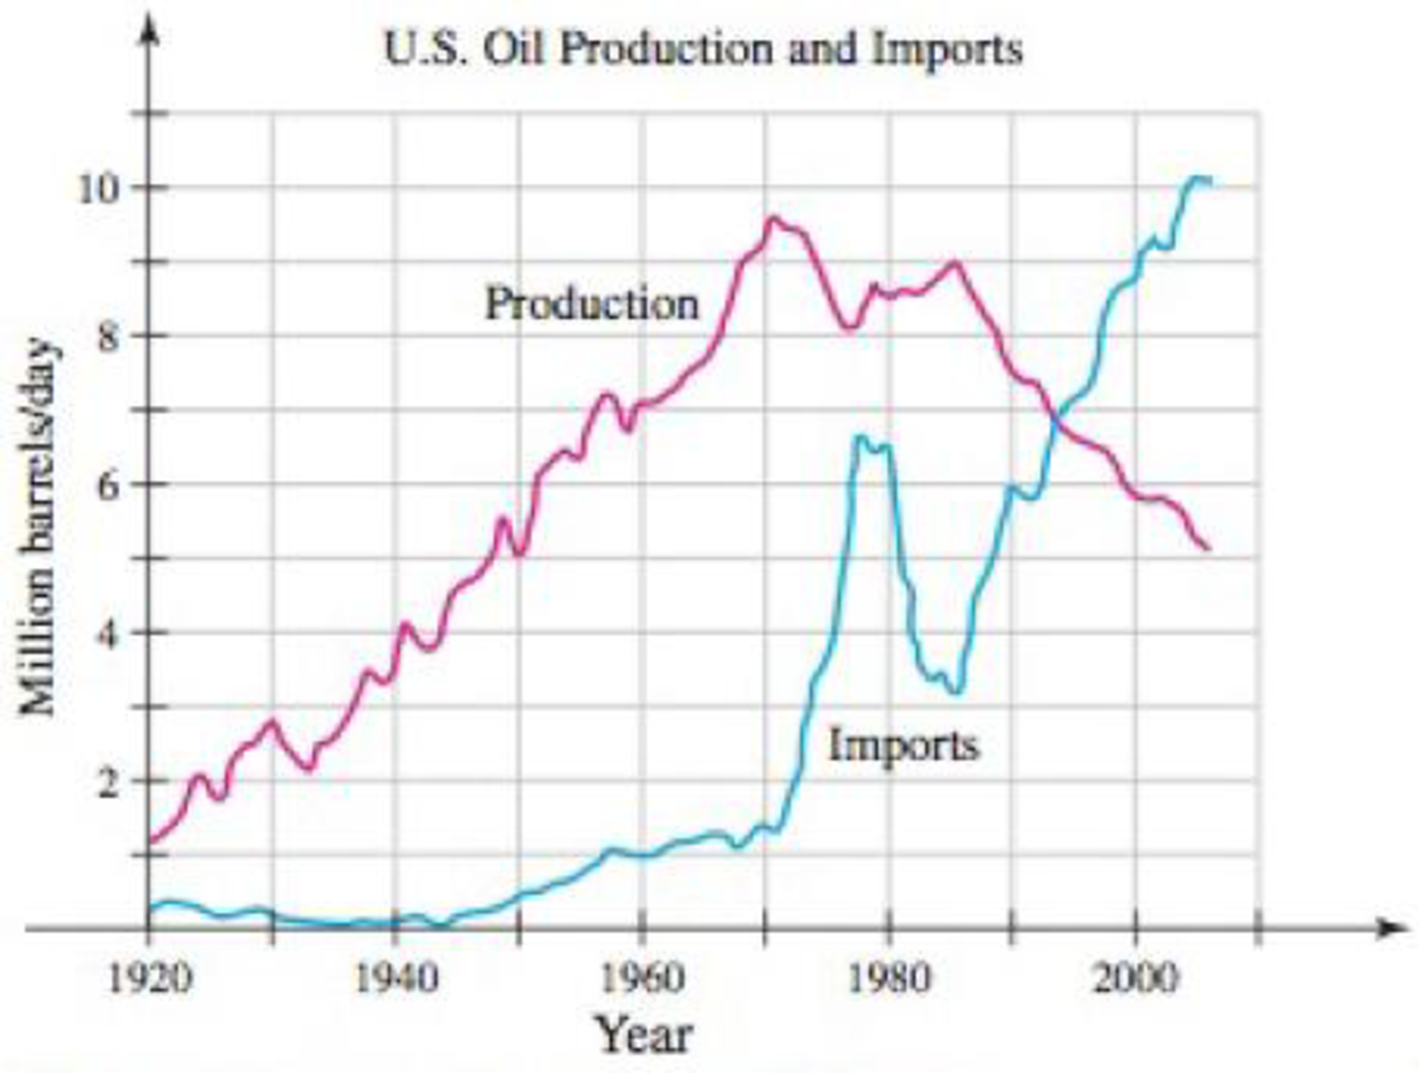
(Source: U.S. Energy Information Administration)
Expert Solution & Answer
Want to see the full answer?
Check out a sample textbook solution
Students have asked these similar questions
For the system consisting of the lines:
and
71 = (-8,5,6) + t(4, −5,3)
72 = (0, −24,9) + u(−1, 6, −3)
a) State whether the two lines are parallel or not and justify your answer.
b) Find the point of intersection, if possible, and classify the system based on the
number of points of intersection and how the lines are related. Show a complete
solution process.
3. [-/2 Points]
DETAILS
MY NOTES
SESSCALCET2 7.4.013.
Find the exact length of the curve.
y = In(sec x), 0 ≤ x ≤ π/4
H.w
WI
M
Wz
A
Sindax
Sind dy max
Утах
at 0.75m from A
w=6KN/M L=2
W2=9 KN/m
P= 10 KN
B
Make the solution handwritten and not
artificial intelligence because I will
give a bad rating if you solve it with
artificial intelligence
Chapter 7 Solutions
Single Variable Calculus: Early Transcendentals (2nd Edition) - Standalone book
Ch. 7.1 - Prob. 1QCCh. 7.1 - Prob. 2QCCh. 7.1 - Prob. 3QCCh. 7.1 - Prob. 4QCCh. 7.1 - What change of variables would you use for the...Ch. 7.1 - Prob. 2ECh. 7.1 - What trigonometric identity is useful in...Ch. 7.1 - Describe a first step in integrating x32x+4x1dx.Ch. 7.1 - Prob. 5ECh. 7.1 - Prob. 6E
Ch. 7.1 - Substitution Review Evaluate the following...Ch. 7.1 - Substitution Review Evaluate the following...Ch. 7.1 - Substitution Review Evaluate the following...Ch. 7.1 - Substitution Review Evaluate the following...Ch. 7.1 - Substitution Review Evaluate the following...Ch. 7.1 - Substitution Review Evaluate the following...Ch. 7.1 - Substitution Review Evaluate the following...Ch. 7.1 - Substitution Review Evaluate the following...Ch. 7.1 - Subtle substitutions Evaluate the following...Ch. 7.1 - Subtle substitutions Evaluate the following...Ch. 7.1 - Subtle substitutions Evaluate the following...Ch. 7.1 - Prob. 18ECh. 7.1 - Subtle substitutions Evaluate the following...Ch. 7.1 - Subtle substitutions Evaluate the following...Ch. 7.1 - Subtle substitutions Evaluate the following...Ch. 7.1 - Prob. 22ECh. 7.1 - Splitting fractions Evaluate the following...Ch. 7.1 - Splitting fractions Evaluate the following...Ch. 7.1 - Splitting fractions Evaluate the following...Ch. 7.1 - Splitting fractions Evaluate the following...Ch. 7.1 - Splitting fractions Evaluate the following...Ch. 7.1 - Splitting fractions Evaluate the following...Ch. 7.1 - Division with rational functions Evaluate the...Ch. 7.1 - Division with rational functions Evaluate the...Ch. 7.1 - Division with rational functions Evaluate the...Ch. 7.1 - Prob. 32ECh. 7.1 - Completing the square Evaluate the following...Ch. 7.1 - Completing the square Evaluate the following...Ch. 7.1 - Completing the square Evaluate the following...Ch. 7.1 - Completing the square Evaluate the following...Ch. 7.1 - Multiply by 1 Evaluate the following integrals....Ch. 7.1 - Multiply by 1 Evaluate the following integrals....Ch. 7.1 - Multiply by 1 Evaluate the following integrals....Ch. 7.1 - Multiply by 1 Evaluate the following integrals....Ch. 7.1 - Further Explorations 41. Explain why or why not...Ch. 7.1 - Miscellaneous integrals Use the approaches...Ch. 7.1 - Miscellaneous integrals Use the approaches...Ch. 7.1 - Miscellaneous integrals Use the approaches...Ch. 7.1 - Miscellaneous integrals Use the approaches...Ch. 7.1 - Miscellaneous integrals Use the approaches...Ch. 7.1 - Miscellaneous integrals Use the approaches...Ch. 7.1 - Miscellaneous integrals Use the approaches...Ch. 7.1 - Miscellaneous integrals Use the approaches...Ch. 7.1 - Miscellaneous integrals Use the approaches...Ch. 7.1 - Miscellaneous integrals Use the approaches...Ch. 7.1 - Prob. 52ECh. 7.1 - Miscellaneous integrals Use the approaches...Ch. 7.1 - Miscellaneous integrals Use the approaches...Ch. 7.1 - Different substitutions a. Evaluate tanxsec2xdx...Ch. 7.1 - Different methods a. Evaluate cotxcsc2xdx using...Ch. 7.1 - Different methods a. Evaluate x2x+1dx using the...Ch. 7.1 - Different substitutions a. Show that...Ch. 7.1 - Area of a region between curves Find the area of...Ch. 7.1 - Area of a region between curves Find the area of...Ch. 7.1 - Prob. 61ECh. 7.1 - Prob. 62ECh. 7.1 - Arc length Find the length of the curve y = x5/4...Ch. 7.1 - Surface area Find the area of the surface...Ch. 7.1 - Surface area Let f(x)=x+1. Find the area of the...Ch. 7.1 - Skydiving A skydiver in free fall subject to...Ch. 7.2 - Prob. 1QCCh. 7.2 - Prob. 2QCCh. 7.2 - Prob. 3QCCh. 7.2 - On which derivative rule is integration by parts...Ch. 7.2 - How would you choose dv when evaluating xneaxdx...Ch. 7.2 - Prob. 3ECh. 7.2 - Explain how integration by parts is used to...Ch. 7.2 - Prob. 5ECh. 7.2 - Prob. 6ECh. 7.2 - Integration by parts Evaluate the following...Ch. 7.2 - Integration by parts Evaluate the following...Ch. 7.2 - Integration by parts Evaluate the following...Ch. 7.2 - Integration by parts Evaluate the following...Ch. 7.2 - Integration by parts Evaluate the following...Ch. 7.2 - Integration by parts Evaluate the following...Ch. 7.2 - Integration by parts Evaluate the following...Ch. 7.2 - Integration by parts Evaluate the following...Ch. 7.2 - Integration by parts Evaluate the following...Ch. 7.2 - Integration by parts Evaluate the following...Ch. 7.2 - Integration by parts Evaluate the following...Ch. 7.2 - Integration by parts Evaluate the following...Ch. 7.2 - Integration by parts Evaluate the following...Ch. 7.2 - Prob. 20ECh. 7.2 - Integration by parts Evaluate the following...Ch. 7.2 - Integration by parts Evaluate the following...Ch. 7.2 - Repeated integration by parts Evaluate the...Ch. 7.2 - Repeated integration by parts Evaluate the...Ch. 7.2 - Repeated integration by parts Evaluate the...Ch. 7.2 - Repeated integration by parts Evaluate the...Ch. 7.2 - Repeated integration by parts Evaluate the...Ch. 7.2 - Repeated integration by parts Evaluate the...Ch. 7.2 - Repeated integration by parts Evaluate the...Ch. 7.2 - Repeated integration by parts Evaluate the...Ch. 7.2 - Definite integrals Evaluate the following definite...Ch. 7.2 - Definite integrals Evaluate the following definite...Ch. 7.2 - Definite integrals Evaluate the following definite...Ch. 7.2 - Definite integrals Evaluate the following definite...Ch. 7.2 - Definite integrals Evaluate the following definite...Ch. 7.2 - Definite integrals Evaluate the following definite...Ch. 7.2 - Definite integrals Evaluate the following definite...Ch. 7.2 - Prob. 38ECh. 7.2 - Volumes of solids Find the volume of the solid...Ch. 7.2 - Volumes of solids Find the volume of the solid...Ch. 7.2 - Volumes of solids Find the volume of the solid...Ch. 7.2 - Volumes of solids Find the volume of the solid...Ch. 7.2 - Reduction formulas Use integration by parts to...Ch. 7.2 - Reduction formulas Use integration by parts to...Ch. 7.2 - Reduction formulas Use integration by parts to...Ch. 7.2 - Reduction formulas Use integration by parts to...Ch. 7.2 - Prob. 48ECh. 7.2 - Prob. 49ECh. 7.2 - Prob. 50ECh. 7.2 - Prob. 51ECh. 7.2 - Integrals involving lnxdx Use a substitution to...Ch. 7.2 - Integrals involving lnxdx Use a substitution to...Ch. 7.2 - Two methods a. Evaluate xlnx2dx using the...Ch. 7.2 - Logarithm base b Prove that logbxdx=1lnb(xlnxx)+C.Ch. 7.2 - Two integration methods Evaluate sinxcosxdx using...Ch. 7.2 - Combining two integration methods Evaluate cosxdx...Ch. 7.2 - Prob. 58ECh. 7.2 - Function defined as an integral Find the arc...Ch. 7.2 - A family of exponentials The curves y = xeax are...Ch. 7.2 - Solid of revolution Find the volume of the solid...Ch. 7.2 - Prob. 62ECh. 7.2 - Comparing volumes Let R be the region bounded by y...Ch. 7.2 - Log integrals Use integration by parts to show...Ch. 7.2 - A useful integral a. Use integration by parts to...Ch. 7.2 - Integrating inverse functions Assume that f has an...Ch. 7.2 - Integral of sec3 x Use integration by parts to...Ch. 7.2 - Two useful exponential integrals Use integration...Ch. 7.2 - Prob. 69ECh. 7.2 - Find the error Suppose you evaluate dxx using...Ch. 7.2 - Prob. 71ECh. 7.2 - Practice with tabular integration Evaluate the...Ch. 7.2 - Prob. 73ECh. 7.2 - Integrating derivatives Use integration by parts...Ch. 7.2 - An identity Show that if f has a continuous second...Ch. 7.2 - An identity Show that if f and g have continuous...Ch. 7.2 - Possible and impossible integrals Let In=xnex2dx,...Ch. 7.2 - Looking ahead (to Chapter 9) Suppose that a...Ch. 7.3 - Prob. 1QCCh. 7.3 - Prob. 2QCCh. 7.3 - State the half-angle identities used to integrate...Ch. 7.3 - State the three Pythagorean identities.Ch. 7.3 - Describe the method used to integrate sin3 x.Ch. 7.3 - Describe the method used to integrate sinm x cosn...Ch. 7.3 - What is a reduction formula?Ch. 7.3 - How would you evaluate cos2xsin3xdx?Ch. 7.3 - How would you evaluate tan10xsec2xdx?Ch. 7.3 - How would you evaluate sec12xtanxdx?Ch. 7.3 - Integrals of sin x or cos x Evaluate the following...Ch. 7.3 - Integrals of sin x or cos x Evaluate the following...Ch. 7.3 - Integrals of sin x or cos x Evaluate the following...Ch. 7.3 - Integrals of sin x or cos x Evaluate the following...Ch. 7.3 - Integrals of sin x or cos x Evaluate the following...Ch. 7.3 - Integrals of sin x or cos x Evaluate the following...Ch. 7.3 - Integrals of sin x and cos x Evaluate the...Ch. 7.3 - Integrals of sin x and cos x Evaluate the...Ch. 7.3 - Integrals of sin x and cos x Evaluate the...Ch. 7.3 - Integrals of sin x and cos x Evaluate the...Ch. 7.3 - Integrals of sin x and cos x Evaluate the...Ch. 7.3 - Integrals of sin x and cos x Evaluate the...Ch. 7.3 - Prob. 21ECh. 7.3 - Integrals of sin x and cos x Evaluate the...Ch. 7.3 - Integrals of sin x and cos x Evaluate the...Ch. 7.3 - Integrals of sin x and cos x Evaluate the...Ch. 7.3 - Integrals of tan x or cot x Evaluate the following...Ch. 7.3 - Integrals of tan x or cot x Evaluate the following...Ch. 7.3 - Integrals of tan x or cot x Evaluate the following...Ch. 7.3 - Integrals of tan x or cot x Evaluate the following...Ch. 7.3 - Integrals of tan x or cot x Evaluate the following...Ch. 7.3 - Integrals of tan x or cot x Evaluate the following...Ch. 7.3 - Integrals involving tan x and sec x Evaluate the...Ch. 7.3 - Integrals involving tan x and sec x Evaluate the...Ch. 7.3 - Integrals involving tan x and sec x Evaluate the...Ch. 7.3 - Integrals involving tan x and sec x Evaluate the...Ch. 7.3 - Integrals involving tan x and sec x Evaluate the...Ch. 7.3 - Integrals involving tan x and sec x Evaluate the...Ch. 7.3 - Integrals involving tan x and sec x Evaluate the...Ch. 7.3 - Integrals involving tan x and sec x Evaluate the...Ch. 7.3 - Integrals involving tan x and sec x Evaluate the...Ch. 7.3 - Integrals involving tan x and sec x Evaluate the...Ch. 7.3 - Integrals involving tan x and sec x Evaluate the...Ch. 7.3 - Integrals involving tan x and sec x Evaluate the...Ch. 7.3 - Integrals involving tan x and sec x Evaluate the...Ch. 7.3 - Integrals involving tan x and sec x Evaluate the...Ch. 7.3 - Explain why or why not Determine whether the...Ch. 7.3 - Prob. 46ECh. 7.3 - Prob. 47ECh. 7.3 - Prob. 48ECh. 7.3 - Prob. 49ECh. 7.3 - Additional integrals Evaluate the following...Ch. 7.3 - Additional integrals Evaluate the following...Ch. 7.3 - Prob. 52ECh. 7.3 - Additional integrals Evaluate the following...Ch. 7.3 - Prob. 54ECh. 7.3 - Additional integrals Evaluate the following...Ch. 7.3 - Prob. 56ECh. 7.3 - Additional integrals Evaluate the following...Ch. 7.3 - Prob. 58ECh. 7.3 - Square roots Evaluate the following integrals. 59....Ch. 7.3 - Square roots Evaluate the following integrals. 60....Ch. 7.3 - Square roots Evaluate the following integrals. 61....Ch. 7.3 - Sine football Find the volume of the solid...Ch. 7.3 - Arc length Find the length of the curve y = ln...Ch. 7.3 - Prob. 64ECh. 7.3 - A tangent reduction formula Prove that for...Ch. 7.3 - A secant reduction formula Prove that for positive...Ch. 7.3 - Integrals of the form sinmxcosnxdx Use the...Ch. 7.3 - Integrals of the form sinmxcosnxdx Use the...Ch. 7.3 - Integrals of the form sinmxcosnxdx Use the...Ch. 7.3 - Integrals of the form sinmxcosnxdx Use the...Ch. 7.3 - Integrals of the form sinmxcosnxdx Use the...Ch. 7.3 - Mercator map projection The Mercator map...Ch. 7.3 - Prob. 73ECh. 7.4 - Prob. 1QCCh. 7.4 - Prob. 2QCCh. 7.4 - Prob. 3QCCh. 7.4 - What change of variables is suggested by an...Ch. 7.4 - What change of variables is suggested by an...Ch. 7.4 - What change of variables is suggested by an...Ch. 7.4 - If x = 4 tan , express sin in terms of x.Ch. 7.4 - If x = 2 sin , express cot in terms of x.Ch. 7.4 - If x = 8 sec , express tan in terms of x.Ch. 7.4 - Sine substitution Evaluate the following...Ch. 7.4 - Sine substitution Evaluate the following...Ch. 7.4 - Sine substitution Evaluate the following...Ch. 7.4 - Sine substitution Evaluate the following...Ch. 7.4 - Sine substitution Evaluate the following...Ch. 7.4 - Sine substitution Evaluate the following...Ch. 7.4 - Sine substitution Evaluate the following...Ch. 7.4 - Sine substitution Evaluate the following...Ch. 7.4 - Prob. 15ECh. 7.4 - Sine substitution Evaluate the following...Ch. 7.4 - Trigonometric substitutions Evaluate the following...Ch. 7.4 - Trigonometric substitutions Evaluate the following...Ch. 7.4 - Prob. 19ECh. 7.4 - Trigonometric substitutions Evaluate the following...Ch. 7.4 - Trigonometric substitutions Evaluate the following...Ch. 7.4 - Trigonometric substitutions Evaluate the following...Ch. 7.4 - Prob. 23ECh. 7.4 - Trigonometric substitutions Evaluate the following...Ch. 7.4 - Trigonometric substitutions Evaluate the following...Ch. 7.4 - Prob. 26ECh. 7.4 - Trigonometric substitutions Evaluate the following...Ch. 7.4 - Trigonometric substitutions Evaluate the following...Ch. 7.4 - Trigonometric substitutions Evaluate the following...Ch. 7.4 - Prob. 30ECh. 7.4 - Trigonometric substitutions Evaluate the following...Ch. 7.4 - Trigonometric substitutions Evaluate the following...Ch. 7.4 - Trigonometric substitutions Evaluate the following...Ch. 7.4 - Prob. 34ECh. 7.4 - Prob. 35ECh. 7.4 - Prob. 36ECh. 7.4 - Trigonometric substitutions Evaluate the following...Ch. 7.4 - Trigonometric substitutions Evaluate the following...Ch. 7.4 - Trigonometric substitutions Evaluate the following...Ch. 7.4 - Trigonometric substitutions Evaluate the following...Ch. 7.4 - Prob. 41ECh. 7.4 - Trigonometric substitutions Evaluate the following...Ch. 7.4 - Trigonometric substitutions Evaluate the following...Ch. 7.4 - Trigonometric substitutions Evaluate the following...Ch. 7.4 - Trigonometric substitutions Evaluate the following...Ch. 7.4 - Prob. 46ECh. 7.4 - Prob. 47ECh. 7.4 - Evaluating definite integrals Evaluate the...Ch. 7.4 - Evaluating definite integrals Evaluate the...Ch. 7.4 - Evaluating definite integrals Evaluate the...Ch. 7.4 - Evaluating definite integrals Evaluate the...Ch. 7.4 - Evaluating definite integrals Evaluate the...Ch. 7.4 - Prob. 53ECh. 7.4 - Evaluating definite integrals Evaluate the...Ch. 7.4 - Evaluating definite integrals Evaluate the...Ch. 7.4 - Prob. 56ECh. 7.4 - Explain why or why not Determine whether the...Ch. 7.4 - Completing the square Evaluate the following...Ch. 7.4 - Completing the square Evaluate the following...Ch. 7.4 - Completing the square Evaluate the following...Ch. 7.4 - Completing the square Evaluate the following...Ch. 7.4 - Prob. 62ECh. 7.4 - Completing the square Evaluate the following...Ch. 7.4 - Completing the square Evaluate the following...Ch. 7.4 - Completing the square Evaluate the following...Ch. 7.4 - Area of an ellipse The upper half of the ellipse...Ch. 7.4 - Area of a segment of a circle Use two approaches...Ch. 7.4 - Area of a lune A lune is a crescent-shaped region...Ch. 7.4 - Area and volume Consider the function f(x) = (9 +...Ch. 7.4 - Prob. 70ECh. 7.4 - Arc length of a parabola Find the length of the...Ch. 7.4 - Prob. 72ECh. 7.4 - Using the integral of sec3 u By reduction formula...Ch. 7.4 - Using the integral of sec3 u By reduction formula...Ch. 7.4 - Prob. 75ECh. 7.4 - Asymmetric integrands Evaluate the following...Ch. 7.4 - Asymmetric integrands Evaluate the following...Ch. 7.4 - Prob. 78ECh. 7.4 - Prob. 79ECh. 7.4 - Prob. 80ECh. 7.4 - Prob. 81ECh. 7.4 - Magnetic field due to current in a straight wire A...Ch. 7.4 - Prob. 83ECh. 7.4 - Show that...Ch. 7.4 - Evaluate for x21x3dx, for x 1 and for x 1.Ch. 7.4 - Prob. 87ECh. 7.4 - Prob. 88ECh. 7.4 - Prob. 89ECh. 7.5 - Prob. 1QCCh. 7.5 - Prob. 2QCCh. 7.5 - Prob. 3QCCh. 7.5 - Prob. 4QCCh. 7.5 - What kinds of functions can be integrated using...Ch. 7.5 - Give an example of each of the following. a. A...Ch. 7.5 - What term(s) should appear in the partial fraction...Ch. 7.5 - Prob. 4ECh. 7.5 - Prob. 5ECh. 7.5 - Setting up partial fraction decomposition Give the...Ch. 7.5 - Setting up partial fraction decomposition Give the...Ch. 7.5 - Setting up partial fraction decomposition Give the...Ch. 7.5 - Setting up partial fraction decomposition Give the...Ch. 7.5 - Setting up partial fraction decomposition Give the...Ch. 7.5 - Setting up partial fraction decomposition Give the...Ch. 7.5 - Setting up partial fraction decomposition Give the...Ch. 7.5 - Simple linear factors Evaluate the following...Ch. 7.5 - Simple linear factors Evaluate the following...Ch. 7.5 - Simple linear factors Evaluate the following...Ch. 7.5 - Simple linear factors Evaluate the following...Ch. 7.5 - Simple linear factors Evaluate the following...Ch. 7.5 - Simple linear factors Evaluate the following...Ch. 7.5 - Simple linear factors Evaluate the following...Ch. 7.5 - Simple linear factors Evaluate the following...Ch. 7.5 - Simple linear factors Evaluate the following...Ch. 7.5 - Simple linear factors Evaluate the following...Ch. 7.5 - Simple linear factors Evaluate the following...Ch. 7.5 - Simple linear factors Evaluate the following...Ch. 7.5 - Simple linear factors Evaluate the following...Ch. 7.5 - Simple linear factors Evaluate the following...Ch. 7.5 - Repeated linear factors Evaluate the following...Ch. 7.5 - Repeated linear factors Evaluate the following...Ch. 7.5 - Repeated linear factors Evaluate the following...Ch. 7.5 - Repeated linear factors Evaluate the following...Ch. 7.5 - Repeated linear factors Evaluate the following...Ch. 7.5 - Repeated linear factors Evaluate the following...Ch. 7.5 - Repeated linear factors Evaluate the following...Ch. 7.5 - Repeated linear factors Evaluate the following...Ch. 7.5 - Repeated linear factors Evaluate the following...Ch. 7.5 - Prob. 36ECh. 7.5 - Repeated linear factors Evaluate the following...Ch. 7.5 - Prob. 38ECh. 7.5 - Setting up partial fraction decompositions Give...Ch. 7.5 - Prob. 40ECh. 7.5 - Setting up partial fraction decompositions Give...Ch. 7.5 - Prob. 42ECh. 7.5 - Simple irreducible quadratic factors Evaluate the...Ch. 7.5 - Simple irreducible quadratic factors Evaluate the...Ch. 7.5 - Simple irreducible quadratic factors Evaluate the...Ch. 7.5 - Simple irreducible quadratic factors Evaluate the...Ch. 7.5 - Simple irreducible quadratic factors Evaluate the...Ch. 7.5 - Prob. 48ECh. 7.5 - Prob. 49ECh. 7.5 - Simple irreducible quadratic factors Evaluate the...Ch. 7.5 - Explain why or why not Determine whether the...Ch. 7.5 - Prob. 52ECh. 7.5 - Areas of regions Find the area of the following...Ch. 7.5 - Prob. 54ECh. 7.5 - Prob. 55ECh. 7.5 - Prob. 56ECh. 7.5 - Volumes of solids Find the volume of the following...Ch. 7.5 - Prob. 58ECh. 7.5 - Volumes of solids Find the volume of the following...Ch. 7.5 - Prob. 60ECh. 7.5 - Prob. 61ECh. 7.5 - Whats wrong? Why are there no constants A and B...Ch. 7.5 - Preliminary steps The following integrals require...Ch. 7.5 - Preliminary steps The following integrals require...Ch. 7.5 - Prob. 65ECh. 7.5 - Prob. 66ECh. 7.5 - Prob. 67ECh. 7.5 - Prob. 68ECh. 7.5 - Preliminary steps The following integrals require...Ch. 7.5 - Preliminary steps The following integrals require...Ch. 7.5 - Preliminary steps The following integrals require...Ch. 7.5 - Preliminary steps The following integrals require...Ch. 7.5 - Prob. 73ECh. 7.5 - Preliminary steps The following integrals require...Ch. 7.5 - Prob. 75ECh. 7.5 - Prob. 76ECh. 7.5 - Prob. 77ECh. 7.5 - Prob. 78ECh. 7.5 - Prob. 79ECh. 7.5 - Fractional powers Use the indicated substitution...Ch. 7.5 - Prob. 81ECh. 7.5 - Prob. 82ECh. 7.5 - Repeated quadratic factors Refer to the summary...Ch. 7.5 - Repeated quadratic factors Refer to the summary...Ch. 7.5 - Prob. 85ECh. 7.5 - Prob. 86ECh. 7.5 - Two methods Evaluate dxx21, for x l, in two ways;...Ch. 7.5 - Rational functions of trigonometric functions An...Ch. 7.5 - Prob. 89ECh. 7.5 - Rational functions of trigonometric functions An...Ch. 7.5 - Rational functions of trigonometric functions An...Ch. 7.5 - Prob. 92ECh. 7.5 - Prob. 93ECh. 7.5 - Prob. 94ECh. 7.5 - Three start-ups Three cars. A, B, and C, start...Ch. 7.5 - Prob. 96ECh. 7.5 - Prob. 97ECh. 7.5 - Prob. 98ECh. 7.6 - Prob. 1QCCh. 7.6 - Prob. 2QCCh. 7.6 - Prob. 3QCCh. 7.6 - Give some examples of analytical methods for...Ch. 7.6 - Prob. 2ECh. 7.6 - Prob. 3ECh. 7.6 - Is a reduction formula an analytical method or a...Ch. 7.6 - Table lookup integrals Use a table of integrals to...Ch. 7.6 - Table lookup integrals Use a table of integrals to...Ch. 7.6 - Table lookup integrals Use a table of integrals to...Ch. 7.6 - Table lookup integrals Use a table of integrals to...Ch. 7.6 - Table lookup integrals Use a table of integrals to...Ch. 7.6 - Table lookup integrals Use a table of integrals to...Ch. 7.6 - Table lookup integrals Use a table of integrals to...Ch. 7.6 - Table lookup integrals Use a table of integrals to...Ch. 7.6 - Table lookup integrals Use a table of integrals to...Ch. 7.6 - Table lookup integrals Use a table of integrals to...Ch. 7.6 - Table lookup integrals Use a table of integrals to...Ch. 7.6 - Table lookup integrals Use a table of integrals to...Ch. 7.6 - Table lookup integrals Use a table of integrals to...Ch. 7.6 - Prob. 18ECh. 7.6 - Table lookup integrals Use a table of integrals to...Ch. 7.6 - Table lookup integrals Use a table of integrals to...Ch. 7.6 - Table lookup integrals Use a table of integrals to...Ch. 7.6 - Table lookup integrals Use a table of integrals to...Ch. 7.6 - Preliminary work Use a table of integrals to...Ch. 7.6 - Preliminary work Use a table of integrals to...Ch. 7.6 - Preliminary work Use a table of integrals to...Ch. 7.6 - Prob. 26ECh. 7.6 - Preliminary work Use a table of integrals to...Ch. 7.6 - Prob. 28ECh. 7.6 - Preliminary work Use a table of integrals to...Ch. 7.6 - Prob. 30ECh. 7.6 - Preliminary work Use a table of integrals to...Ch. 7.6 - Preliminary work Use a table of integrals to...Ch. 7.6 - Preliminary work Use a table of integrals to...Ch. 7.6 - Preliminary work Use a table of integrals to...Ch. 7.6 - Preliminary work Use a table of integrals to...Ch. 7.6 - Preliminary work Use a table of integrals to...Ch. 7.6 - Preliminary work Use a table of integrals to...Ch. 7.6 - Preliminary work Use a table of integrals to...Ch. 7.6 - Geometry problems Use a table of integrals to...Ch. 7.6 - Prob. 40ECh. 7.6 - Prob. 41ECh. 7.6 - Geometry problems Use a table of integrals to...Ch. 7.6 - Prob. 43ECh. 7.6 - Geometry problems Use a table of integrals to...Ch. 7.6 - Prob. 45ECh. 7.6 - Geometry problems Use a table of integrals to...Ch. 7.6 - Apparent discrepancy Resolve the apparent...Ch. 7.6 - Reduction formulas Use the reduction formulas in a...Ch. 7.6 - Reduction formulas Use the reduction formulas in a...Ch. 7.6 - Reduction formulas Use the reduction formulas in a...Ch. 7.6 - Reduction formulas Use the reduction formulas in a...Ch. 7.6 - Evaluating an integral without the Fundamental...Ch. 7.6 - Two integration approaches Evaluate cos(lnx)dx two...Ch. 7.6 - Arc length of a parabola Let L(c) be the length of...Ch. 7.6 - Deriving formulas Evaluate the following...Ch. 7.6 - Deriving formulas Evaluate the following...Ch. 7.6 - Deriving formulas Evaluate the following...Ch. 7.6 - Deriving formulas Evaluate the following...Ch. 7.7 - Prob. 1QCCh. 7.7 - Prob. 2QCCh. 7.7 - Prob. 3QCCh. 7.7 - Prob. 4QCCh. 7.7 - If the interval [4, 18] is partitioned into n = 28...Ch. 7.7 - Explain geometrically how the Midpoint Rule is...Ch. 7.7 - Prob. 3ECh. 7.7 - If the Midpoint Rule is used on the interval [1,...Ch. 7.7 - If the Trapezoid Rule is used on the interval [1,...Ch. 7.7 - Prob. 6ECh. 7.7 - Absolute and relative error Compute the absolute...Ch. 7.7 - Absolute and relative error Compute the absolute...Ch. 7.7 - Midpoint Rule approximations Find the indicated...Ch. 7.7 - Midpoint Rule approximations Find the indicated...Ch. 7.7 - Midpoint Rule approximations Find the indicated...Ch. 7.7 - Midpoint Rule approximations Find the indicated...Ch. 7.7 - Trapezoid Rule approximations Find the indicated...Ch. 7.7 - Prob. 16ECh. 7.7 - Trapezoid Rule approximations Find the indicated...Ch. 7.7 - Trapezoid Rule approximations Find the indicated...Ch. 7.7 - Midpoint Rule, Trapezoid Rule, and relative error...Ch. 7.7 - Midpoint Rule, Trapezoid Rule, and relative error...Ch. 7.7 - Comparing the Midpoint and Trapezoid Rules Apply...Ch. 7.7 - Comparing the Midpoint and Trapezoid Rules Apply...Ch. 7.7 - Prob. 23ECh. 7.7 - Prob. 24ECh. 7.7 - Prob. 25ECh. 7.7 - Comparing the Midpoint and Trapezoid Rules Apply...Ch. 7.7 - Temperature data Hourly temperature data for...Ch. 7.7 - Temperature data Hourly temperature data for...Ch. 7.7 - Temperature data Hourly temperature data for...Ch. 7.7 - Temperature data Hourly temperature data for...Ch. 7.7 - Nonuniform grids Use the indicated methods to...Ch. 7.7 - Nonuniform grids Use the indicated methods to...Ch. 7.7 - Nonuniform grids Use the indicated methods to...Ch. 7.7 - Nonuniform grids Use the indicated methods to...Ch. 7.7 - Trapezoid Rule and Simpsons Rule Consider the...Ch. 7.7 - Trapezoid Rule and Simpsons Rule Consider the...Ch. 7.7 - Trapezoid Rule and Simpsons Rule Consider the...Ch. 7.7 - Prob. 38ECh. 7.7 - Simpsons Rule Apply Simpsons Rule to the following...Ch. 7.7 - Prob. 40ECh. 7.7 - Simpsons Rule Apply Simpsons Rule to the following...Ch. 7.7 - Prob. 42ECh. 7.7 - Explain why or why not Determine whether the...Ch. 7.7 - Comparing the Midpoint and Trapezoid Rules Compare...Ch. 7.7 - Comparing the Midpoint and Trapezoid Rules Compare...Ch. 7.7 - Prob. 46ECh. 7.7 - Prob. 47ECh. 7.7 - Prob. 48ECh. 7.7 - Prob. 49ECh. 7.7 - Using Simpsons Rule Approximate the following...Ch. 7.7 - Prob. 51ECh. 7.7 - Period of a pendulum A standard pendulum of length...Ch. 7.7 - Prob. 53ECh. 7.7 - Prob. 54ECh. 7.7 - Normal distribution of heights The heights of U.S....Ch. 7.7 - Prob. 56ECh. 7.7 - U.S. oil produced and imported The figure shows...Ch. 7.7 - Estimating error Refer to Theorem 7.2 and let...Ch. 7.7 - Estimating error Refer to Theorem 7.2 and let f(x)...Ch. 7.7 - Exact Trapezoid Rule Prove that the Trapezoid Rule...Ch. 7.7 - Prob. 61ECh. 7.7 - Shortcut for the Trapezoid Rule Given a Midpoint...Ch. 7.7 - Prob. 63ECh. 7.7 - Shortcut for Simpsons Rule Using the notation of...Ch. 7.7 - Another Simpsons Rule formula Another Simpsons...Ch. 7.8 - Prob. 1QCCh. 7.8 - Prob. 2QCCh. 7.8 - Prob. 3QCCh. 7.8 - What are the two general ways in which an improper...Ch. 7.8 - Explain how to evaluate af(x)dx.Ch. 7.8 - Prob. 3ECh. 7.8 - Infinite intervals of integration Evaluate the...Ch. 7.8 - Infinite intervals of integration Evaluate the...Ch. 7.8 - Infinite intervals of integration Evaluate the...Ch. 7.8 - Infinite intervals of integration Evaluate the...Ch. 7.8 - Infinite intervals of integration Evaluate the...Ch. 7.8 - Infinite intervals of integration Evaluate the...Ch. 7.8 - Infinite intervals of integration Evaluate the...Ch. 7.8 - Infinite intervals of integration Evaluate the...Ch. 7.8 - Infinite intervals of integration Evaluate the...Ch. 7.8 - Infinite intervals of integration Evaluate the...Ch. 7.8 - Infinite intervals of integration Evaluate the...Ch. 7.8 - Prob. 16ECh. 7.8 - Infinite intervals of integration Evaluate the...Ch. 7.8 - Infinite intervals of integration Evaluate the...Ch. 7.8 - Infinite intervals of integration Evaluate the...Ch. 7.8 - Prob. 20ECh. 7.8 - Infinite intervals of integration Evaluate the...Ch. 7.8 - Infinite intervals of integration Evaluate the...Ch. 7.8 - Infinite intervals of integration Evaluate the...Ch. 7.8 - Prob. 24ECh. 7.8 - Infinite intervals of integration Evaluate the...Ch. 7.8 - Infinite intervals of integration Evaluate the...Ch. 7.8 - Infinite intervals of integration Evaluate the...Ch. 7.8 - Infinite intervals of integration Evaluate the...Ch. 7.8 - Volumes on infinite intervals Find the volume of...Ch. 7.8 - Volumes on infinite intervals Find the volume of...Ch. 7.8 - Volumes on infinite intervals Find the volume of...Ch. 7.8 - Volumes on infinite intervals Find the volume of...Ch. 7.8 - Volumes on infinite intervals Find the volume of...Ch. 7.8 - Volumes on infinite intervals Find the volume of...Ch. 7.8 - Integrals with unbounded integrands Evaluate the...Ch. 7.8 - Prob. 36ECh. 7.8 - Integrals with unbounded integrands Evaluate the...Ch. 7.8 - Integrals with unbounded integrands Evaluate the...Ch. 7.8 - Integrals with unbounded integrands Evaluate the...Ch. 7.8 - Integrals with unbounded integrands Evaluate the...Ch. 7.8 - Integrals with unbounded integrands Evaluate the...Ch. 7.8 - Integrals with unbounded integrands Evaluate the...Ch. 7.8 - Integrals with unbounded integrands Evaluate the...Ch. 7.8 - Integrals with unbounded integrands Evaluate the...Ch. 7.8 - Integrals with unbounded integrands Evaluate the...Ch. 7.8 - Integrals with unbounded integrands Evaluate the...Ch. 7.8 - Integrals with unbounded integrands Evaluate the...Ch. 7.8 - Integrals with unbounded integrands Evaluate the...Ch. 7.8 - Integrals with unbounded integrands Evaluate the...Ch. 7.8 - Integrals with unbounded integrands Evaluate the...Ch. 7.8 - Volumes with infinite integrands Find the volume...Ch. 7.8 - Volumes with infinite integrands Find the volume...Ch. 7.8 - Volumes with infinite integrands Find the volume...Ch. 7.8 - Volumes with infinite integrands Find the volume...Ch. 7.8 - Volumes with infinite integrands Find the volume...Ch. 7.8 - Volumes with infinite integrands Find the volume...Ch. 7.8 - Bioavailability When a drug is given...Ch. 7.8 - Draining a pool Water is drained from a swimming...Ch. 7.8 - Maximum distance An object moves on a line with...Ch. 7.8 - Prob. 60ECh. 7.8 - Explain why or why not Determine whether the...Ch. 7.8 - Prob. 62ECh. 7.8 - Prob. 63ECh. 7.8 - Prob. 64ECh. 7.8 - Prob. 65ECh. 7.8 - Prob. 66ECh. 7.8 - Integration by parts Use integration by parts to...Ch. 7.8 - Prob. 68ECh. 7.8 - A close comparison Graph the integrands and then...Ch. 7.8 - Area between curves Let R be the region bounded by...Ch. 7.8 - Area between curves Let R be the region bounded by...Ch. 7.8 - An area function Let A(a) denote the area of the...Ch. 7.8 - Regions bounded by exponentials Let a 0 and let R...Ch. 7.8 - Prob. 74ECh. 7.8 - Prob. 75ECh. 7.8 - Prob. 76ECh. 7.8 - Prob. 77ECh. 7.8 - Prob. 78ECh. 7.8 - Prob. 79ECh. 7.8 - Prob. 80ECh. 7.8 - Perpetual annuity Imagine that today you deposit B...Ch. 7.8 - Draining a tank Water is drained from a 3000-gal...Ch. 7.8 - Decaying oscillations Let a 0 and b be real...Ch. 7.8 - Electronic chips Suppose the probability that a...Ch. 7.8 - Prob. 85ECh. 7.8 - The Eiffel Tower property Let R be the region...Ch. 7.8 - Escape velocity and black holes The work required...Ch. 7.8 - Adding a proton to a nucleus The nucleus of an...Ch. 7.8 - Prob. 89ECh. 7.8 - Laplace transforms A powerful tool in solving...Ch. 7.8 - Laplace transforms A powerful tool in solving...Ch. 7.8 - Laplace transforms A powerful tool in solving...Ch. 7.8 - Laplace transforms A powerful tool in solving...Ch. 7.8 - Laplace transforms A powerful tool in solving...Ch. 7.8 - Improper integrals Evaluate the following improper...Ch. 7.8 - A better way Compute 01lnxdx using integration by...Ch. 7.8 - Prob. 97ECh. 7.8 - Gamma function The gamma function is defined by...Ch. 7.8 - Many methods needed Show that 0xlnx(1+x)2dx= in...Ch. 7.8 - Prob. 100ECh. 7.8 - Prob. 101ECh. 7.8 - Prob. 102ECh. 7.9 - Prob. 1QCCh. 7.9 - Prob. 2QCCh. 7.9 - Prob. 3QCCh. 7.9 - Prob. 4QCCh. 7.9 - Prob. 1ECh. 7.9 - Is y(t) + 9y(t) = 10 linear or nonlinear?Ch. 7.9 - Prob. 3ECh. 7.9 - Prob. 4ECh. 7.9 - Prob. 5ECh. 7.9 - Prob. 6ECh. 7.9 - Prob. 7ECh. 7.9 - Prob. 8ECh. 7.9 - Verifying general solutions Verify that the given...Ch. 7.9 - Verifying general solutions Verify that the given...Ch. 7.9 - Verifying general solutions Verify that the given...Ch. 7.9 - Verifying general solutions Verify that the given...Ch. 7.9 - Prob. 13ECh. 7.9 - Prob. 14ECh. 7.9 - Prob. 15ECh. 7.9 - Prob. 16ECh. 7.9 - Prob. 17ECh. 7.9 - Prob. 18ECh. 7.9 - Prob. 19ECh. 7.9 - Prob. 20ECh. 7.9 - First-order linear equations Find the general...Ch. 7.9 - First-order linear equations Find the general...Ch. 7.9 - Prob. 23ECh. 7.9 - Prob. 24ECh. 7.9 - Initial value problems Solve the following...Ch. 7.9 - Initial value problems Solve the following...Ch. 7.9 - Initial value problems Solve the following...Ch. 7.9 - Prob. 28ECh. 7.9 - Prob. 29ECh. 7.9 - Prob. 30ECh. 7.9 - Separable differential equations Find the general...Ch. 7.9 - Separable differential equations Find the general...Ch. 7.9 - Separable differential equations Find the general...Ch. 7.9 - Separable differential equations Find the general...Ch. 7.9 - Separable differential equations Determine whether...Ch. 7.9 - Separable differential equations Determine whether...Ch. 7.9 - Separable differential equations Determine whether...Ch. 7.9 - Separable differential equations Determine whether...Ch. 7.9 - Separable differential equations Determine whether...Ch. 7.9 - Prob. 40ECh. 7.9 - Prob. 41ECh. 7.9 - Prob. 42ECh. 7.9 - Prob. 43ECh. 7.9 - Direction fields A differential equation and its...Ch. 7.9 - Matching direction fields Match equations ad with...Ch. 7.9 - Sketching direction fields Use the window [2, 2] ...Ch. 7.9 - Sketching direction fields Use the window [2, 2] ...Ch. 7.9 - Prob. 48ECh. 7.9 - Prob. 49ECh. 7.9 - Prob. 50ECh. 7.9 - Prob. 51ECh. 7.9 - Prob. 52ECh. 7.9 - Prob. 53ECh. 7.9 - Prob. 54ECh. 7.9 - Prob. 55ECh. 7.9 - Prob. 56ECh. 7.9 - Prob. 57ECh. 7.9 - Prob. 58ECh. 7.9 - Prob. 59ECh. 7.9 - Prob. 60ECh. 7.9 - Logistic equation for spread of rumors...Ch. 7.9 - Prob. 62ECh. 7.9 - Prob. 63ECh. 7.9 - Prob. 64ECh. 7.9 - Chemical rate equations The reaction of chemical...Ch. 7.9 - Prob. 66ECh. 7.9 - Prob. 67ECh. 7.9 - Prob. 68ECh. 7.9 - Prob. 69ECh. 7.9 - Prob. 70ECh. 7 - Explain why or why not Determine whether the...Ch. 7 - Basic integration techniques Use the methods...Ch. 7 - Basic integration techniques Use the methods...Ch. 7 - Basic integration techniques Use the methods...Ch. 7 - Basic integration techniques Use the methods...Ch. 7 - Basic integration techniques Use the methods...Ch. 7 - Basic integration techniques Use the methods...Ch. 7 - Integration by parts Use integration by parts to...Ch. 7 - Integration by parts Use integration by parts to...Ch. 7 - Prob. 10RECh. 7 - Prob. 11RECh. 7 - Trigonometric integrals Evaluate the following...Ch. 7 - Trigonometric integrals Evaluate the following...Ch. 7 - Prob. 14RECh. 7 - Trigonometric integrals Evaluate the following...Ch. 7 - Prob. 16RECh. 7 - Prob. 17RECh. 7 - Prob. 18RECh. 7 - Trigonometric substitutions Evaluate the following...Ch. 7 - Prob. 20RECh. 7 - Prob. 21RECh. 7 - Partial fractions Use partial fractions to...Ch. 7 - Partial fractions Use partial fractions to...Ch. 7 - Partial fractions Use partial fractions to...Ch. 7 - Partial fractions Use partial fractions to...Ch. 7 - Table of integrals Use a table of integrals to...Ch. 7 - Table of integrals Use a table of integrals to...Ch. 7 - Table of integrals Use a table of integrals to...Ch. 7 - Table of integrals Use a table of integrals to...Ch. 7 - Errors in numerical integration Let...Ch. 7 - Prob. 33RECh. 7 - Improper integrals Evaluate the following...Ch. 7 - Improper integrals Evaluate the following...Ch. 7 - Improper integrals Evaluate the following...Ch. 7 - Improper integrals Evaluate the following...Ch. 7 - Miscellaneous Integrals Evaluate the following...Ch. 7 - Miscellaneous Integrals Evaluate the following...Ch. 7 - Miscellaneous Integrals Evaluate the following...Ch. 7 - Miscellaneous Integrals Evaluate the following...Ch. 7 - Miscellaneous Integrals Evaluate the following...Ch. 7 - Prob. 43RECh. 7 - Miscellaneous Integrals Evaluate the following...Ch. 7 - Prob. 45RECh. 7 - Prob. 46RECh. 7 - Prob. 47RECh. 7 - Prob. 48RECh. 7 - Prob. 49RECh. 7 - Prob. 50RECh. 7 - Prob. 51RECh. 7 - Prob. 52RECh. 7 - Prob. 53RECh. 7 - Prob. 54RECh. 7 - Prob. 55RECh. 7 - Prob. 56RECh. 7 - Prob. 57RECh. 7 - Miscellaneous Integrals Evaluate the following...Ch. 7 - Miscellaneous Integrals Evaluate the following...Ch. 7 - Miscellaneous Integrals Evaluate the following...Ch. 7 - Miscellaneous Integrals Evaluate the following...Ch. 7 - Miscellaneous Integrals Evaluate the following...Ch. 7 - Miscellaneous Integrals Evaluate the following...Ch. 7 - Preliminary work Make a change of variables or use...Ch. 7 - Preliminary work Make a change of variables or use...Ch. 7 - Preliminary work Make a change of variables or use...Ch. 7 - Preliminary work Make a change of variables or use...Ch. 7 - Preliminary work Make a change of variables or use...Ch. 7 - Preliminary work Make a change of variables or use...Ch. 7 - Prob. 70RECh. 7 - Volumes The region R is bounded by the curve y =...Ch. 7 - Volumes The region R is bounded by the curve y =...Ch. 7 - Volumes The region R is bounded by the curve y =...Ch. 7 - Volumes The region R is bounded by the curve y =...Ch. 7 - Comparing volumes Let R be the region bounded by...Ch. 7 - Comparing areas Show that the area of the region...Ch. 7 - Zero log integral It is evident from the graph of...Ch. 7 - Arc length Find the length of the curve y = ln x...Ch. 7 - Average velocity Find the average velocity of a...Ch. 7 - Comparing distances Starting at the same time and...Ch. 7 - Traffic flow When data from a traffic study are...Ch. 7 - Comparing integrals Graph the functions f(x) = ...Ch. 7 - A family of logarithm integrals Let...Ch. 7 - Arc length Find the length of the curve...Ch. 7 - Best approximation Let I=01x2xlnxdx. Use any...Ch. 7 - Numerical integration Use a calculator to...Ch. 7 - Numerical integration Use a calculator to...Ch. 7 - Two worthy integrals a. Let I(a)=0dx(1+xa)(1+x2),...Ch. 7 - Comparing volumes Let R be the region bounded by y...Ch. 7 - Equal volumes a. Let R be the region bounded by...Ch. 7 - Equal volumes Let R1 be the region bounded by the...Ch. 7 - Prob. 92RECh. 7 - Prob. 93RECh. 7 - Prob. 94RECh. 7 - Prob. 95RECh. 7 - Prob. 96RECh. 7 - Prob. 97RECh. 7 - Prob. 98RECh. 7 - Prob. 99RECh. 7 - Prob. 100RECh. 7 - Prob. 101RECh. 7 - Prob. 102RE
Additional Math Textbook Solutions
Find more solutions based on key concepts
Whether the requirements for a hypothesis test are satisfied or not.
Elementary Statistics
In Exercises 1–8, integrate the given function over the given surface.
2. Circular cylinder G(x, y, z) = z, ove...
University Calculus: Early Transcendentals (4th Edition)
Read about basic ideas of statistics in Common Core Standards for grades 3-5, and discuss why students at these...
A Problem Solving Approach To Mathematics For Elementary School Teachers (13th Edition)
x vs. Two symbols are used for the mean: and x. a. Which represents a parameter, and which a statistic? b. In...
Introductory Statistics
How many outcome sequences are possible ten a die is rolled four times, where we say, for instance, that the ou...
A First Course in Probability (10th Edition)
Knowledge Booster


Learn more about
Need a deep-dive on the concept behind this application? Look no further. Learn more about this topic, calculus and related others by exploring similar questions and additional content below.Similar questions
- Solve by DrWz WI P L B dy Sind Ⓡ de max ⑦Ymax dx Solve by Dr ③Yat 0.75m from A w=6KN/M L=2 W2=9 kN/m P= 10 KN Solve By Drarrow_forwardHow to find the radius of convergence for the series in the image below? I'm stuck on how to isolate the x in the interval of convergence.arrow_forwardDetermine the exact signed area between the curve g(x): x-axis on the interval [0,1]. = tan2/5 secx dx andarrow_forward
- A factorization A = PDP 1 is not unique. For A= 7 2 -4 1 1 1 5 0 2 1 one factorization is P = D= and P-1 30 = Use this information with D₁ = to find a matrix P₁ such that - -1 -2 0 3 1 - - 1 05 A-P,D,P P1 (Type an integer or simplified fraction for each matrix element.)arrow_forwardMatrix A is factored in the form PDP 1. Use the Diagonalization Theorem to find the eigenvalues of A and a basis for each eigenspace. 30 -1 - 1 0 -1 400 0 0 1 A= 3 4 3 0 1 3 040 3 1 3 0 0 4 1 0 0 003 -1 0 -1 Select the correct choice below and fill in the answer boxes to complete your choice. (Use a comma to separate vectors as needed.) A basis for the corresponding eigenspace is { A. There is one distinct eigenvalue, λ = B. In ascending order, the two distinct eigenvalues are λ₁ ... = and 2 = Bases for the corresponding eigenspaces are { and ( ), respectively. C. In ascending order, the three distinct eigenvalues are λ₁ = = 12/2 = and 3 = Bases for the corresponding eigenspaces are {}, }, and { respectively.arrow_forwardN Page 0.6. 0.4. 0.2- -0.2- -0.4- -6.6 -5 W 10arrow_forward
arrow_back_ios
SEE MORE QUESTIONS
arrow_forward_ios
Recommended textbooks for you
 Algebra & Trigonometry with Analytic GeometryAlgebraISBN:9781133382119Author:SwokowskiPublisher:Cengage
 Big Ideas Math A Bridge To Success Algebra 1: Stu...AlgebraISBN:9781680331141Author:HOUGHTON MIFFLIN HARCOURTPublisher:Houghton Mifflin Harcourt
 Glencoe Algebra 1, Student Edition, 9780079039897...AlgebraISBN:9780079039897Author:CarterPublisher:McGraw Hill
 Holt Mcdougal Larson Pre-algebra: Student Edition...AlgebraISBN:9780547587776Author:HOLT MCDOUGALPublisher:HOLT MCDOUGAL
 College Algebra (MindTap Course List)AlgebraISBN:9781305652231Author:R. David Gustafson, Jeff HughesPublisher:Cengage Learning
 Functions and Change: A Modeling Approach to Coll...AlgebraISBN:9781337111348Author:Bruce Crauder, Benny Evans, Alan NoellPublisher:Cengage Learning
Algebra & Trigonometry with Analytic Geometry
Algebra
ISBN:9781133382119
Author:Swokowski
Publisher:Cengage
Big Ideas Math A Bridge To Success Algebra 1: Stu...
Algebra
ISBN:9781680331141
Author:HOUGHTON MIFFLIN HARCOURT
Publisher:Houghton Mifflin Harcourt
Glencoe Algebra 1, Student Edition, 9780079039897...
Algebra
ISBN:9780079039897
Author:Carter
Publisher:McGraw Hill
Holt Mcdougal Larson Pre-algebra: Student Edition...
Algebra
ISBN:9780547587776
Author:HOLT MCDOUGAL
Publisher:HOLT MCDOUGAL
College Algebra (MindTap Course List)
Algebra
ISBN:9781305652231
Author:R. David Gustafson, Jeff Hughes
Publisher:Cengage Learning
Functions and Change: A Modeling Approach to Coll...
Algebra
ISBN:9781337111348
Author:Bruce Crauder, Benny Evans, Alan Noell
Publisher:Cengage Learning
Correlation Vs Regression: Difference Between them with definition & Comparison Chart; Author: Key Differences;https://www.youtube.com/watch?v=Ou2QGSJVd0U;License: Standard YouTube License, CC-BY
Correlation and Regression: Concepts with Illustrative examples; Author: LEARN & APPLY : Lean and Six Sigma;https://www.youtube.com/watch?v=xTpHD5WLuoA;License: Standard YouTube License, CC-BY