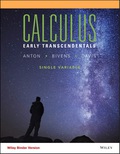
A graph of the acceleration a versus time t for an object moving on a straight line is shown in the accompanying figure. Estimate the accelerations at t = 0 , 1 , 2 , ... , 8 seconds (S) from the graph and use Simpson’s rule to approximate the change in velocity from t = 0 to t = 8 s. Round your answer to the nearest tenth cm/s.
A graph of the acceleration a versus time t for an object moving on a straight line is shown in the accompanying figure. Estimate the accelerations at t = 0 , 1 , 2 , ... , 8 seconds (S) from the graph and use Simpson’s rule to approximate the change in velocity from t = 0 to t = 8 s. Round your answer to the nearest tenth cm/s.
A graph of the acceleration a versus time
t
for an object moving on a straight line is shown in the accompanying figure. Estimate the accelerations at
t
=
0
,
1
,
2
,
...
,
8 seconds (S) from the graph and use Simpson’s rule to approximate the change in velocity from
t
=
0
to
t
=
8
s. Round your answer to the nearest tenth cm/s.
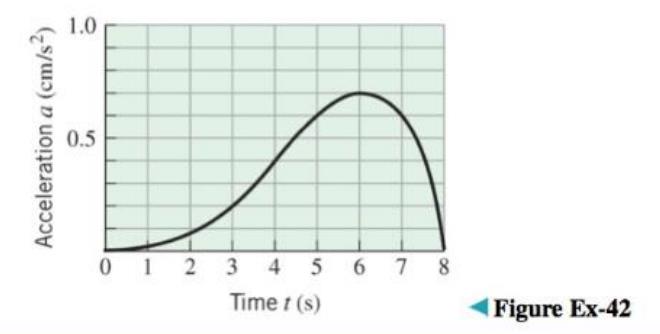
For the given graph, determine the following.
-3
12
УА
4
3
-
-1
°
1 2
3
x
-1.
-2-
a. Determine for which values of a the lim f (x) exists but f is not continuous at x = a.
a
b. Determine for which values of a the function is continuous but not differentiable at x = a.
a
Use the following graph of ƒ (x) to evaluate ƒ' (−1) and ƒ' (2).
y
+10+
9
8
7
6
5
4
3
2
1-
-10 -9 -8 -7 -6 -5 -4 -3 -2 -1
x
3
4
0
8 9 10
-2
3
-4
5
-6
-7
-8
-9
-10-
f'(-1)=
f' (2)
Need a deep-dive on the concept behind this application? Look no further. Learn more about this topic, calculus and related others by exploring similar questions and additional content below.


 Algebra: Structure And Method, Book 1AlgebraISBN:9780395977224Author:Richard G. Brown, Mary P. Dolciani, Robert H. Sorgenfrey, William L. ColePublisher:McDougal Littell
 Functions and Change: A Modeling Approach to Coll...AlgebraISBN:9781337111348Author:Bruce Crauder, Benny Evans, Alan NoellPublisher:Cengage Learning

 Algebra & Trigonometry with Analytic GeometryAlgebraISBN:9781133382119Author:SwokowskiPublisher:Cengage
 Trigonometry (MindTap Course List)TrigonometryISBN:9781337278461Author:Ron LarsonPublisher:Cengage Learning