Videos
To write: The system of inequalities that describes the region shown in the given graph.
Answer to Problem 54E
The system of inequalities that describes the region in the graph is
Explanation of Solution
Given information:
Thegraph of a system of inequalities is given below:
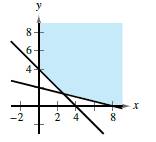
From the graph, it is evident that the region falls in the first quadrant. Therefore,
Now, observing the graph, one line has the x -intercept at
Since the region falls above the line, the inequality corresponding to the line would be
Similarly, other line has the x -intercept at
Since the region falls above the line, the inequality corresponding to the line would be
Conclusion:
Therefore the system of inequalities that describes the region in the graph is
Chapter 7 Solutions
Precalculus with Limits


- 2. Find the Bezier surface equation using the 9 control points shown below. Use the u and v directions shown. It is required to show all the calculation processes for finding Bernstein polynomials. Find the surface tangent, twist and normal vectors at point u=0.5 and v=0.5. (40 points) y 10 9 8 7 6 5 4 3 2 Poo и 1 1 2 3 4 5 6 7 8 9 10 10 Xarrow_forwardA cable runs along the wall from C to P at a cost of $24 per meter, and straight from P to M at a cost of $26 per meter. If M is 10 meters from the nearest point A on the wall where P lies, and A is 72 meters from C, find the distance from C to P such that the cost of installing the cable is minimized and find this cost. C 72 P A 10 Marrow_forwardThe number of bank robberies in a country for the years 2010-2018 is given in the following figure. Consider the closed interval [2010,2018]. (a) Give all relative maxima and minima and when they occur on the interval. (b) Give the absolute maxima and minima and when they occur on the interval. Incidents 7000- 6000-5 5482 5000- 4424 4273 4822 4000- 3708 3748 4229 4089 3000- 2582 2000- 1000- 0 2010 2012 2014 2016 2018 Yeararrow_forward
- please do 8.1 q7arrow_forwardplease do 8.1 q6arrow_forwardIf the price charged for a candy bar is p(x) cents, then x thousand candy bars will be sold in a certain city, where p(x)=158- X 10° a. Find an expression for the total revenue from the sale of x thousand candy bars. b. Find the value of x that leads to maximum revenue. c. Find the maximum revenue.arrow_forward
- 3 The total profit P(X) (in thousands of dollars) from the sale of x hundred thousand automobile tires is approximated by P(x) = -x³ + 12x² + 60x - 200, x≥5. Find the number of hundred thousands of tires that must be sold to maximize profit. Find the maximum profit. The maximum profit is $ when hundred thousand tires are sold.arrow_forwardA fence must be built to enclose a rectangular area of 5000 ft². Fencing material costs $4 per foot for the two sides facing north and south and $8 per foot for the other two sides. Find the cost of the least expensive fence. The cost of the least expensive fence is $ (Simplify your answer.)arrow_forwardThe number of fish swimming upstream to spawn is approximated by the function given below, where x represents the temperature of the water in degrees Celsius. Find the water temperature that produces the maximum number of fish swimming upstream. F(x) = x3 + 3x² + 360x + 5017, 5≤x≤18arrow_forward
- A campground owner has 500 m of fencing. He wants to enclose a rectangular field bordering a river, with no fencing along the river. (See the sketch.) Let x represent the width of the field. (a) Write an expression for the length of the field as a function of x. (b) Find the area of the field (area = length x width) as a function of x. (c) Find the value of x leading to the maximum area. (d) Find the maximum area. x Riverarrow_forwardA rectangular tank with a square base, an open top, and a volume of 1372 ft³ is to be constructed of sheet steel. Find the dimensions of the tank that has the minimum surface area. The dimensions of the tank with minimum surface area are (Simplify your answer. Use a comma to separate answers.) ft.arrow_forwardWrite an equation for the function graphed below 5+ 4 - -7 -6 -5 -4 -3 -2 -1 y = 3. 2 1 + 1 2 3 4 5 6 7 -1 -3 -4 5 -5+ aarrow_forward
 Calculus: Early TranscendentalsCalculusISBN:9781285741550Author:James StewartPublisher:Cengage Learning
 Thomas' Calculus (14th Edition)CalculusISBN:9780134438986Author:Joel R. Hass, Christopher E. Heil, Maurice D. WeirPublisher:PEARSON
 Calculus: Early Transcendentals (3rd Edition)CalculusISBN:9780134763644Author:William L. Briggs, Lyle Cochran, Bernard Gillett, Eric SchulzPublisher:PEARSON
 Calculus: Early TranscendentalsCalculusISBN:9781319050740Author:Jon Rogawski, Colin Adams, Robert FranzosaPublisher:W. H. Freeman
 Calculus: Early Transcendental FunctionsCalculusISBN:9781337552516Author:Ron Larson, Bruce H. EdwardsPublisher:Cengage Learning