
Videos
The figure shows the healthy weight region for various heights for people ages 35 and older.
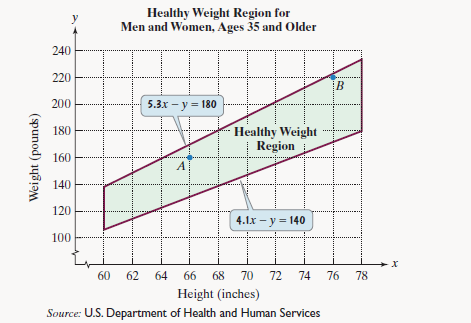
If x represents height, in inches, and y represents weight, in pounds, the healthy weight region can be modeled by the following system of linear inequalities:
Use this information to solve Exercises 45-48.
Show that point A is a solution of the system of inequalities that describes healthy weight for this age group.
Want to see the full answer?
Check out a sample textbook solution
Chapter 7 Solutions
THINK.MATH.LOOSELEAF W/18 WEEK MATHLAB


- The graph of f', the derivative of f, is shown in the graph below. If f(-9) = -5, what is the value of f(-1)? y 87 19 6 LO 5 4 3 1 Graph of f' x -10 -9 -8 -7 -6 -5 -4 -3 -2 -1 1 2 3 4 5 6 7 8 9 10 -1 -2 -3 -4 -5 -6 -7 -8 564%arrow_forwardFind the geometric center of shapearrow_forwardLet S = be a set of k vectors in R^, with karrow_forwardarrow_back_iosSEE MORE QUESTIONSarrow_forward_ios
 Holt Mcdougal Larson Pre-algebra: Student Edition...AlgebraISBN:9780547587776Author:HOLT MCDOUGALPublisher:HOLT MCDOUGAL
 Glencoe Algebra 1, Student Edition, 9780079039897...AlgebraISBN:9780079039897Author:CarterPublisher:McGraw Hill
 College AlgebraAlgebraISBN:9781305115545Author:James Stewart, Lothar Redlin, Saleem WatsonPublisher:Cengage Learning
 College Algebra (MindTap Course List)AlgebraISBN:9781305652231Author:R. David Gustafson, Jeff HughesPublisher:Cengage Learning
 Algebra: Structure And Method, Book 1AlgebraISBN:9780395977224Author:Richard G. Brown, Mary P. Dolciani, Robert H. Sorgenfrey, William L. ColePublisher:McDougal Littell
 Algebra and Trigonometry (MindTap Course List)AlgebraISBN:9781305071742Author:James Stewart, Lothar Redlin, Saleem WatsonPublisher:Cengage Learning