
Concept explainers
Videos
Use the Collocation Method with
a.
b.
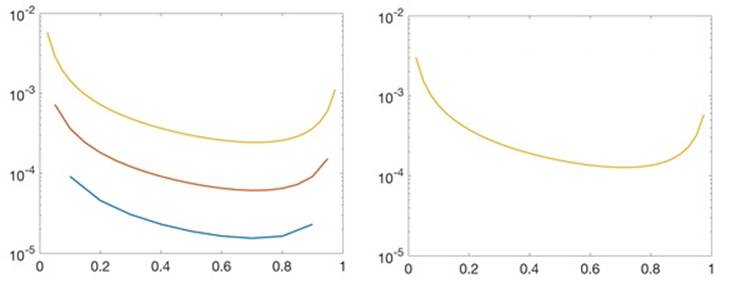
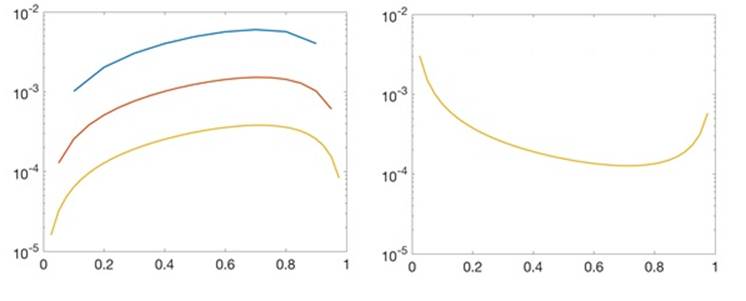
Plot the approximate solutions together with the exact solutions (a)
a.
To find: Approximate solution for linear boundary value problem by collocation method.
Explanation of Solution
% Program for Finite element solution of linear BVP
% Inputs are interval inter, boundary values bv, number of steps n
% Output: solution values c
function c=bvpfem(inter,bv,n)
a=inter(1);b=inter(2);ya=bv(1);yb=bv(2);
h=(b-a)/(n+1);
alpha=(8/3)*h+2/h; beta = (2/3)*h-1/h;
e=ones(n,1);
M=spdiags([beta*e alpha*e beta*e],-1:1,n,n);
d=zeros(n,1);
d(1)= -ya*beta;
d(n)= -yb*beta;
c=M\d;
c= bvpfem([0 1],[0 0.33e],8);
Collocation is applied
b.
To find: Approximate solution for linear boundary value problem by collocation method.
Explanation of Solution
% Program for Finite element solution of linear BVP
% Inputs are interval inter, boundary values bv, number of steps n
% Output: solution values c
function c=bvpfem(inter,bv,n)
a=inter(1);b=inter(2);ya=bv(1);yb=bv(2);
h=(b-a)/(n+1);
alpha=(8/3)*h+2/h; beta = (2)*h-4/h;
e=ones(n,1);
M=spdiags([beta*e alpha*e beta*e],-1:1,n,n);
d=zeros(n,1);
d(1)= -ya*beta;
d(n)= -yb*beta;
c=M\d;

c= bvpfem([0 1],[1 e],16);
Similar to (a). The first and last equations are c1=1and c1+…+cn=e. The remaining n-2equations are
Substituting
Want to see more full solutions like this?
Chapter 7 Solutions
Numerical Analysis
Additional Math Textbook Solutions
Pathways To Math Literacy (looseleaf)
Elementary Statistics ( 3rd International Edition ) Isbn:9781260092561
College Algebra (7th Edition)
Probability And Statistical Inference (10th Edition)
Elementary Statistics: A Step By Step Approach
Elementary Statistics: Picturing the World (7th Edition)


- 30.4. Suppose that f(2) has a pole of order m at zo. Show that f'(z) has a pole of order m + 1 at zo-arrow_forwardA drink filling machine, when in perfect adjustment, fills the bottles with 8 ounces of drink on an average. Any overfilling or underfilling results in the shutdown and readjustment of the machine. A sample of 20 bottles is selected, and the sample shows an average filling volume of 7.5 ounces. To determine whether the machine is properly adjusted, the correct set of hypotheses Ho: [Select] [Select] H₁: [Select] [Select] > [Select] [Select]arrow_forwardInformation on a packet of seeds claims that 93% of them will germinate. Of the 200 seeds that were planted, only 180 germinated. 95% confidence interval for the true proportion of seeds that germinate based on this sample is (85.8%, 94.2%). Do the data provide evidence against the claim? [Select] The margin of error in the estimate is: [Select] > To keep the margin of error within 3.5% with at least 95% confidence level, the required sample size is: [Select]arrow_forward
- 538 Chapter 13 12. Given: Points E(-4, 1), F(2, 3), G(4, 9), and H(-2, 7) a. Show that EFGH is a rhombus. b. Use slopes to verify that the diagonals are perpendicular. 13. Given: Points R(-4, 5), S(-1, 9), T(7, 3) and U(4, -1) a. Show that RSTU is a rectangle. b. Use the distance formula to verify that the diagonals are congruent. 14. Given: Points N(-1, -5), O(0, 0), P(3, 2), and 2(8, 1) a. Show that NOPQ is an isosceles trapezoid. b. Show that the diagonals are congruent. Decide what special type of quadrilateral HIJK is. Then prove that your answer is correct. 15. H(0, 0) 16. H(0, 1) 17. H(7, 5) 18. H(-3, -3) I(5, 0) I(2,-3) 1(8, 3) I(-5, -6) J(7, 9) K(1, 9) J(-2, -1) K(-4, 3) J(0, -1) K(-1, 1) J(4, -5) K(6,-2) 19. Point N(3, - 4) lies on the circle x² + y² = 25. What is the slope of the (Hint: Recall Theorem 9-1.) - line that is tangent to the circle at N? 20. Point P(6, 7) lies on the circle (x + 2)² + (y − 1)² = 100. What is the slope of the line that is tangent to the circle at…arrow_forwardConsider a set of data ...arrow_forwardFor each graph in Figure 16, determine whether f (1) is larger or smaller than the slope of the secant line between x = 1 and x = 1 + h for h > 0. Explain your reasoningarrow_forward
- Analyze the residuals of a linear regression model and select the best response. yes, the residual plot does not show a curve no, the residual plot shows a curve yes, the residual plot shows a curve no, the residual plot does not show a curve I answered, "No, the residual plot shows a curve." (and this was incorrect). I am not sure why I keep getting these wrong when the answer seems obvious. Please help me understand what the yes and no references in the answer.arrow_forwardDesign a Turing Machine recognizing each of the following languages and draw its state diagram. Note that the transition functions of the Turing Machine must be in the format of “a → b,L/R", namely the machine reads single symbol a from the tape, writes single symbol b to the cell to replace a, and then goes to either left L or right R. You will receive 0 point if you do not follow this instruction. (1) {w|w=a²b³, n ≥ 0} (2) {w|w=a'b³,i0} (3) {w|w a'bick,iarrow_forwardDesign a PDA recognizing each of the following languages and draw its state diagram. Note that the transition function must be in the format of “a, b →c", namely we can only push/pop one symbol into/from the stack one time upon one input symbol. You will receive 0 point if you push/pop multiple symbols into/from the stack one time upon one input symbol. (1) {w|wa"b", n is odd} = (2) {w|w=w², length of w is odd and Σ = {a,b} } (3) {w|w= = a²b²n, n ≥1 } (4) {w|w= =a^bn+mcm, n≥0, m ≥ 1 } (5) {w|w=a²b³n, n≥0} (6) {w|w= = a¹³, n ≥ 1, m≥ 1 and n‡m } Hint: two cases: n > m and narrow_forwardarrow_back_iosSEE MORE QUESTIONSarrow_forward_iosRecommended textbooks for you
 College Algebra (MindTap Course List)AlgebraISBN:9781305652231Author:R. David Gustafson, Jeff HughesPublisher:Cengage Learning
College Algebra (MindTap Course List)AlgebraISBN:9781305652231Author:R. David Gustafson, Jeff HughesPublisher:Cengage Learning