
ESSENTIALS OF STATISTICS 6TH ED W/MYSTA
6th Edition
ISBN: 9781323845820
Author: Triola
Publisher: PEARSON
expand_more
expand_more
format_list_bulleted
Videos
Textbook Question
Chapter 7.2, Problem 6BSC
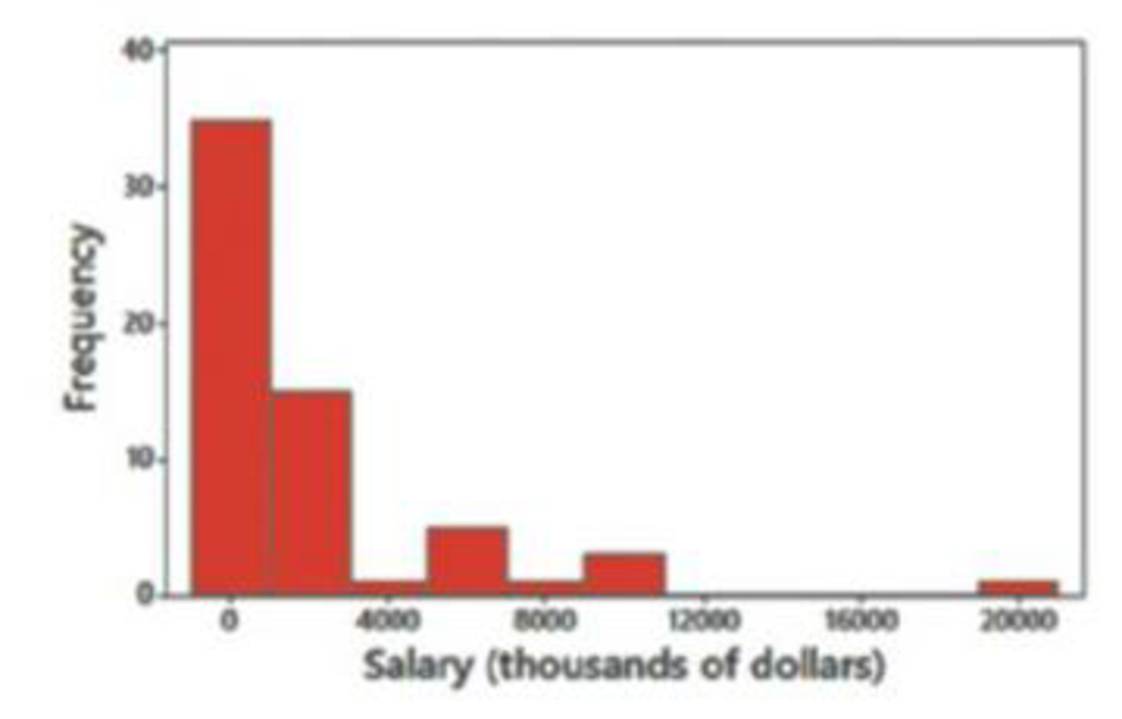
Using Correct Distribution. In Exercises 5–8, assume that we want to construct a confidence interval. Do one of the following, as appropriate: (a) Find the critical value tα/2, (b) find the critical value zα/2 or (c) state that neither the
6. Denver Bronco Salaries Confidence level is 90%, σ is not known, and the histogram of 61 player salaries (thousands of dollars) is as shown.
Expert Solution & Answer

Learn your wayIncludes step-by-step video

schedule01:50
Students have asked these similar questions
Customers experiencing technical difficulty with their Internet cable service may call an 800 number for technical support. It takes the technician between 30 seconds and 11 minutes to resolve the problem. The distribution of this support time follows the uniform distribution.
Required:
a. What are the values for a and b in minutes?
Note: Do not round your intermediate calculations. Round your answers to 1 decimal place.
b-1. What is the mean time to resolve the problem?
b-2. What is the standard deviation of the time?
c. What percent of the problems take more than 5 minutes to resolve?
d. Suppose we wish to find the middle 50% of the problem-solving times. What are the end points of these two times?
Exercise 6-6 (Algo) (LO6-3)
The director of admissions at Kinzua University in Nova Scotia estimated the distribution of student admissions for the fall semester on the basis of past experience.
Admissions
Probability
1,100
0.5
1,400
0.4
1,300
0.1
Click here for the Excel Data File
Required:
What is the expected number of admissions for the fall semester?
Compute the variance and the standard deviation of the number of admissions.
Note: Round your standard deviation to 2 decimal places.
1. Find the mean of the x-values (x-bar)
and the mean of the y-values (y-bar) and write/label each here:
2. Label the second row in the table using proper notation; then, complete the table. In the fifth and sixth
columns, show the 'products' of what you're multiplying, as well as the answers.
X
y
x minus x-bar y minus y-bar (x minus x-bar)(y minus y-bar)
(x minus x-bar)^2
xy
16
20
34
4-2
5 2
3. Write the sums that represents Sxx and Sxy in the table, at the bottom of their respective columns.
4. Find the slope of the Regression line: bi
=
(simplify your answer)
5. Find the y-intercept of the Regression line, and then write the equation of the Regression line.
Show your work. Then, BOX your final answer. Express your line as "y-hat equals...
Chapter 7 Solutions
ESSENTIALS OF STATISTICS 6TH ED W/MYSTA
Ch. 7.1 - Poll Results in the Media USA Today provided...Ch. 7.1 - Margin of Error For the poll described in Exercise...Ch. 7.1 - Notation For the poll described in Exercise 1,...Ch. 7.1 - Confidence Levels Given specific sample data, such...Ch. 7.1 - Finding Critical Values. In Exercises 58, find the...Ch. 7.1 - Finding Critical Values. In Exercises 58, find the...Ch. 7.1 - Finding Critical Values. In Exercises 58, find the...Ch. 7.1 - Finding Critical Values. In Exercises 58, find the...Ch. 7.1 - Formats of Confidence Intervals. In Exercises 912,...Ch. 7.1 - Formats of Confidence Intervals. In Exercises 912,...
Ch. 7.1 - Formats of Confidence Intervals. In Exercises 912,...Ch. 7.1 - Formats of Confidence Intervals. In Exercises 912,...Ch. 7.1 - Constructing and Interpreting Confidence...Ch. 7.1 - Constructing and Interpreting Confidence...Ch. 7.1 - Constructing and Interpreting Confidence...Ch. 7.1 - Constructing and Interpreting Confidence...Ch. 7.1 - Critical Thinking. In Exercises 1728, use the data...Ch. 7.1 - Critical Thinking. In Exercises 1728, use the data...Ch. 7.1 - Critical Thinking. In Exercises 1728, use the data...Ch. 7.1 - Critical Thinking. In Exercises 1728, use the data...Ch. 7.1 - Touch Therapy When she was 9 years of age, Emily...Ch. 7.1 - Critical Thinking. In Exercises 1728, use the data...Ch. 7.1 - Critical Thinking. In Exercises 1728, use the data...Ch. 7.1 - Critical Thinking. In Exercises 1728, use the data...Ch. 7.1 - Critical Thinking. In Exercises 1728, use the data...Ch. 7.1 - Critical Thinking. In Exercises 1728, use the data...Ch. 7.1 - Critical Thinking. In Exercises 1728, use the data...Ch. 7.1 - Critical Thinking. In Exercises 1728, use the data...Ch. 7.1 - Determining Sample Size. In Exercises 3138, use...Ch. 7.1 - Determining Sample Size. In Exercises 3138, use...Ch. 7.1 - Determining Sample Size. In Exercises 3138, use...Ch. 7.1 - Determining Sample Size. In Exercises 3138, use...Ch. 7.1 - Determining Sample Size. In Exercises 3138, use...Ch. 7.1 - Determining Sample Size. In Exercises 3138, use...Ch. 7.1 - Determining Sample Size. In Exercises 3138, use...Ch. 7.1 - Determining Sample Size. In Exercises 3138, use...Ch. 7.1 - Finite Population Correction Factor For Formulas...Ch. 7.1 - One-Sided Confidence Interval A one-sided claim...Ch. 7.1 - Coping with No Success According to the Rule of...Ch. 7.2 - In Exercises 13, refer to the accompanying screen...Ch. 7.2 - Statistical Literacy and Critical Thinking In...Ch. 7.2 - In Exercises 13, refer to the accompanying screen...Ch. 7.2 - Normality Requirement What does it mean when we...Ch. 7.2 - Using Correct Distribution. In Exercises 58,...Ch. 7.2 - Using Correct Distribution. In Exercises 58,...Ch. 7.2 - Using Correct Distribution. In Exercises 58,...Ch. 7.2 - Using Correct Distribution. In Exercises 58,...Ch. 7.2 - Confidence Intervals. In Exercises 924, construct...Ch. 7.2 - Confidence Intervals. In Exercises 924, construct...Ch. 7.2 - Confidence Intervals. In Exercises 924, construct...Ch. 7.2 - Confidence Intervals. In Exercises 924, construct...Ch. 7.2 - Confidence Intervals. In Exercises 924, construct...Ch. 7.2 - Confidence Intervals. In Exercises 924, construct...Ch. 7.2 - Confidence Intervals. In Exercises 924, construct...Ch. 7.2 - Confidence Intervals. In Exercises 924, construct...Ch. 7.2 - Confidence Intervals. In Exercises 924, construct...Ch. 7.2 - Confidence Intervals. In Exercises 924, construct...Ch. 7.2 - Confidence Intervals. In Exercises 924, construct...Ch. 7.2 - Confidence Intervals. In Exercises 924, construct...Ch. 7.2 - Confidence Intervals. In Exercises 924, construct...Ch. 7.2 - Confidence Intervals. In Exercises 924, construct...Ch. 7.2 - Confidence Intervals. In Exercises 924, construct...Ch. 7.2 - Confidence Intervals. In Exercises 924, construct...Ch. 7.2 - Sample Size. In Exercises 2936, find the sample...Ch. 7.2 - Sample Size. In Exercises 2936, find the sample...Ch. 7.2 - Sample Size. In Exercises 2936, find the sample...Ch. 7.2 - Sample Size. In Exercises 2936, find the sample...Ch. 7.2 - Sample Size. In Exercises 2936, find the sample...Ch. 7.2 - Sample Size. In Exercises 2936, find the sample...Ch. 7.2 - Sample Size. In Exercises 2936, find the sample...Ch. 7.2 - Sample Size. In Exercises 2936, find the sample...Ch. 7.2 - Confidence Interval with Known . In Exercises 37...Ch. 7.2 - Confidence Interval with Known . In Exercises 37...Ch. 7.2 - Finite Population Correction Factor If a simple...Ch. 7.3 - Brain Volume Using all of the brain volumes listed...Ch. 7.3 - Expressing Confidence Intervals Example 2 showed...Ch. 7.3 - Last Digit Analysis The dotplot below depicts the...Ch. 7.3 - Normality Requirement What is different about the...Ch. 7.3 - Finding Critical Values and Confidence Intervals....Ch. 7.3 - Finding Critical Values and Confidence Intervals....Ch. 7.3 - Finding Critical Values and Confidence Intervals....Ch. 7.3 - Finding Critical Values and Confidence Intervals....Ch. 7.3 - Finding Confidence Intervals. In Exercises 916,...Ch. 7.3 - Finding Confidence Intervals. In Exercises 916,...Ch. 7.3 - Finding Confidence Intervals. In Exercises 916,...Ch. 7.3 - Finding Confidence Intervals. In Exercises 916,...Ch. 7.3 - Finding Confidence Intervals. In Exercises 916,...Ch. 7.3 - Finding Confidence Intervals. In Exercises 916,...Ch. 7.3 - Finding Confidence Intervals. In Exercises 916,...Ch. 7.3 - Comparing Waiting Lines a. The values listed below...Ch. 7.3 - Determining Sample Size. In Exercises 1922, assume...Ch. 7.3 - Determining Sample Size. In Exercises 1922, assume...Ch. 7.3 - Determining Sample Size. In Exercises 1922, assume...Ch. 7.3 - Determining Sample Size. In Exercises 1922, assume...Ch. 7.3 - Finding Critical Values In constructing confidence...Ch. 7.3 - Finding Sample Size Instead of using Table 7-2 for...Ch. 7.4 - Replacement Why does the bootstrap method require...Ch. 7.4 - Bootstrap Sample Here is a random sample of...Ch. 7.4 - Bootstrap Sample Given the sample data from...Ch. 7.4 - Prob. 4BSCCh. 7.4 - In Exercises 58, use the relatively small number...Ch. 7.4 - In Exercises 58, use the relatively small number...Ch. 7.4 - In Exercises 58, use the relatively small number...Ch. 7.4 - In Exercises 58, use the relatively small number...Ch. 7 - Celebrities and the Law Here is a 95% confidence...Ch. 7 - Interpreting CI Write a brief statement that...Ch. 7 - Critical Value For the survey described in...Ch. 7 - Loose Change USA Today reported that 40% of people...Ch. 7 - Sample Size for Proportion Find the sample size...Ch. 7 - Sample Size for Mean Find the sample size required...Ch. 7 - Requirements A quality control analyst has...Ch. 7 - Degrees of Freedom In general, what does degrees...Ch. 7 - Critical Value Refer to Exercise 7 Requirements...Ch. 7 - Which Method? Refer to Exercise 7 Requirements and...Ch. 7 - Online News In a Harris poll of 2036 adults, 40%...Ch. 7 - Computers In order to better plan for student...Ch. 7 - Earthquake Magnitudes Listed below are Richter...Ch. 7 - Lefties There have been several studies conducted...Ch. 7 - Distributions Identify the distribution (normal,...Ch. 7 - Sample Size You have been hired by your new...Ch. 7 - Wristwatch Accuracy Students of the author...Ch. 7 - Wristwatch Accuracy Use the sample data from...Ch. 7 - Flight Arrivals. Listed below are the arrival...Ch. 7 - Flight Arrivals. Listed below are the arrival...Ch. 7 - Flight Arrivals. Listed below are the arrival...Ch. 7 - Flight Arrivals. Listed below are the arrival...Ch. 7 - Normal Distribution Using a larger data set than...Ch. 7 - Sample Size Find the sample size necessary to...Ch. 7 - Prob. 7CRECh. 7 - Normality Assessment A random sample consists of...Ch. 7 - Critical Thinking: What does the survey tell us?...Ch. 7 - Critical Thinking: What does the survey tell us?...Ch. 7 - Critical Thinking: What does the survey tell us?...Ch. 7 - Critical Thinking: What does the survey tell us?...Ch. 7 - Critical Thinking: What does the survey tell us?...
Additional Math Textbook Solutions
Find more solutions based on key concepts
CHECK POINT 1 In a survey on musical tastes, respondents were asked: Do you listed to classical music? Do you l...
Thinking Mathematically (6th Edition)
Consider a group of 20 people. If everyone shakes hands with everyone else, how many handshakes take place?
A First Course in Probability (10th Edition)
Children of First Ladies This list represents the number of children for the first six “first ladies” of the Un...
Introductory Statistics
Interpreting a P-Value In Exercises 3–8, the P-value for a hypothesis test is shown. Use the P-value to decide ...
Elementary Statistics: Picturing the World (7th Edition)
For what values of a is
continuous at every x?
University Calculus: Early Transcendentals (4th Edition)
Knowledge Booster


Learn more about
Need a deep-dive on the concept behind this application? Look no further. Learn more about this topic, statistics and related others by exploring similar questions and additional content below.Similar questions
- Apply STATA commands & submit the output for each question only when indicated below i. Generate the log of birthweight and family income of children. Name these new variables Ibwght & Ifaminc. Include the output of this code. ii. Apply the command sum with the detail option to the variable faminc. Note: you should find the 25th percentile value, the 50th percentile and the 75th percentile value of faminc from the output - you will need it to answer the next question Include the output of this code. iii. iv. Use the output from part ii of this question to Generate a variable called "high_faminc" that takes a value 1 if faminc is less than or equal to the 25th percentile, it takes the value 2 if faminc is greater than 25th percentile but less than or equal to the 50th percentile, it takes the value 3 if faminc is greater than 50th percentile but less than or equal to the 75th percentile, it takes the value 4 if faminc is greater than the 75th percentile. Include the outcome of this code…arrow_forwardsolve this on paperarrow_forwardApply STATA commands & submit the output for each question only when indicated below i. Apply the command egen to create a variable called "wyd" which is the rowtotal function on variables bwght & faminc. ii. Apply the list command for the first 10 observations to show that the code in part i worked. Include the outcome of this code iii. Apply the egen command to create a new variable called "bwghtsum" using the sum function on variable bwght by the variable high_faminc (Note: need to apply the bysort' statement) iv. Apply the "by high_faminc" statement to find the V. descriptive statistics of bwght and bwghtsum Include the output of this code. Why is there a difference between the standard deviations of bwght and bwghtsum from part iv of this question?arrow_forward
- According to a health information website, the distribution of adults’ diastolic blood pressure (in millimeters of mercury, mmHg) can be modeled by a normal distribution with mean 70 mmHg and standard deviation 20 mmHg. b. Above what diastolic pressure would classify someone in the highest 1% of blood pressures? Show all calculations used.arrow_forwardWrite STATA codes which will generate the outcomes in the questions & submit the output for each question only when indicated below i. ii. iii. iv. V. Write a code which will allow STATA to go to your favorite folder to access your files. Load the birthweight1.dta dataset from your favorite folder and save it under a different filename to protect data integrity. Call the new dataset babywt.dta (make sure to use the replace option). Verify that it contains 2,998 observations and 8 variables. Include the output of this code. Are there missing observations for variable(s) for the variables called bwght, faminc, cigs? How would you know? (You may use more than one code to show your answer(s)) Include the output of your code (s). Write the definitions of these variables: bwght, faminc, male, white, motheduc,cigs; which of these variables are categorical? [Hint: use the labels of the variables & the browse command] Who is this dataset about? Who can use this dataset to answer what kind of…arrow_forwardApply STATA commands & submit the output for each question only when indicated below İ. ii. iii. iv. V. Apply the command summarize on variables bwght and faminc. What is the average birthweight of babies and family income of the respondents? Include the output of this code. Apply the tab command on the variable called male. How many of the babies and what share of babies are male? Include the output of this code. Find the summary statistics (i.e. use the sum command) of the variables bwght and faminc if the babies are white. Include the output of this code. Find the summary statistics (i.e. use the sum command) of the variables bwght and faminc if the babies are male but not white. Include the output of this code. Using your answers to previous subparts of this question: What is the difference between the average birthweight of a baby who is male and a baby who is male but not white? What can you say anything about the difference in family income of the babies that are male and male…arrow_forward
- A public health researcher is studying the impacts of nudge marketing techniques on shoppers vegetablesarrow_forwardThe director of admissions at Kinzua University in Nova Scotia estimated the distribution of student admissions for the fall semester on the basis of past experience. Admissions Probability 1,100 0.5 1,400 0.4 1,300 0.1 Click here for the Excel Data File Required: What is the expected number of admissions for the fall semester? Compute the variance and the standard deviation of the number of admissions. Note: Round your standard deviation to 2 decimal places.arrow_forwardA pollster randomly selected four of 10 available people. Required: How many different groups of 4 are possible? What is the probability that a person is a member of a group? Note: Round your answer to 3 decimal places.arrow_forward
- Wind Mountain is an archaeological study area located in southwestern New Mexico. Potsherds are broken pieces of prehistoric Native American clay vessels. One type of painted ceramic vessel is called Mimbres classic black-on-white. At three different sites the number of such sherds was counted in local dwelling excavations. Test given. Site I Site II Site III 63 19 60 43 34 21 23 49 51 48 11 15 16 46 26 20 31 Find .arrow_forwardRothamsted Experimental Station (England) has studied wheat production since 1852. Each year many small plots of equal size but different soil/fertilizer conditions are planted with wheat. At the end of the growing season, the yield (in pounds) of the wheat on the plot is measured. Suppose for a random sample of years, one plot gave the following annual wheat production (in pounds): 4.46 4.21 4.40 4.81 2.81 2.90 4.93 3.54 4.16 4.48 3.26 4.74 4.97 4.02 4.91 2.59 Use a calculator to verify that the sample variance for this plot is . Another random sample of years for a second plot gave the following annual wheat production (in pounds): 3.89 3.81 3.95 4.07 4.01 3.73 4.02 3.78 3.72 3.96 3.62 3.76 4.02 3.73 3.94 4.03 Use a calculator to verify that the sample variance for this plot is . Suppose that we test the claim using that the population variance of annual wheat production for the first plot is larger…arrow_forwardIt is thought that prehistoric Native Americans did not take their best tools, pottery, and household items when they visited higher elevations for their summer camps. It is hypothesized that archaeological sites tend to lose their cultural identity and specific cultural affiliation as the elevation of the site increases. Let x be the elevation (in thousands of feet) for an archaeological site in the southwestern United States. Let y be the percentage of unidentified artifacts (no specific cultural affiliation) at a given elevation. Suppose that the following data were obtained for a collection of archaeological sites in New Mexico: x 5.50 6.00 6.75 7.00 7.75 y 37 38 92 70 99 Find the equation of the least squares line . Round a and b to three decimal places.arrow_forward
arrow_back_ios
SEE MORE QUESTIONS
arrow_forward_ios
Recommended textbooks for you
 Glencoe Algebra 1, Student Edition, 9780079039897...AlgebraISBN:9780079039897Author:CarterPublisher:McGraw Hill
Glencoe Algebra 1, Student Edition, 9780079039897...
Algebra
ISBN:9780079039897
Author:Carter
Publisher:McGraw Hill
F- Test or F- statistic (F- Test of Equality of Variance); Author: Prof. Arvind Kumar Sing;https://www.youtube.com/watch?v=PdUt7InTyc8;License: Standard Youtube License
Statistics 101: F-ratio Test for Two Equal Variances; Author: Brandon Foltz;https://www.youtube.com/watch?v=UWQO4gX7-lE;License: Standard YouTube License, CC-BY
Hypothesis Testing and Confidence Intervals (FRM Part 1 – Book 2 – Chapter 5); Author: Analystprep;https://www.youtube.com/watch?v=vth3yZIUlGQ;License: Standard YouTube License, CC-BY
Understanding the Levene's Test for Equality of Variances in SPSS; Author: Dr. Todd Grande;https://www.youtube.com/watch?v=udJr8V2P8Xo;License: Standard Youtube License