Concept explainers
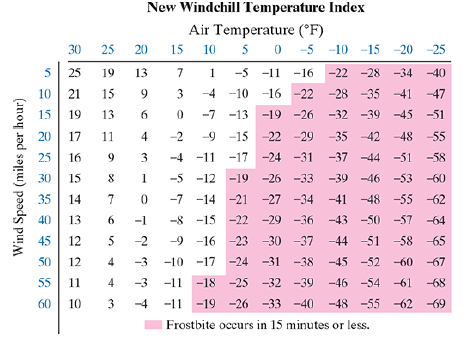
The way that we perceive the temperature on a cold day depends on both air temperature and wind speed. The windchill is what the air temperature would have to be with no wind to achieve the same chilling effect on the skin. In 2002, the National Weather Service issued new windchill temperatures, shown in the table below. (One reason for this new windchill index is that the wind speed is now calculated at 5 feet, the average height of the human body’s face, rather than 33 feet, the height of the standard anemometer, an instrument that calculates wind speed.)
The windchill temperatures shown in the table can be calculated using
in which
a. Rewrite the equation for calculating windchill temperatures using rational exponents.
b. Use the form of the equation in part (a) and a calculator to find the windchill temperature, to the nearest degree, when the air temperature is 25°F and the wind speed is 30 miles per hour.
Want to see the full answer?
Check out a sample textbook solutionChapter 7 Solutions
Intermediate Algebra for College Students (7th Edition)
- The volume of a gas in a container varies inversely as the pressure on the gas. If a container of argon has a volume of 336 cubic inches under a pressure of 2,500 psi, what will be its volume if the pressure is decreased to 2,000 psi?arrow_forwardThe ideal diameter of a rod needed for a machine is 75 mm. The actual diameter can vary from the ideal diameterby 0.05 mm. What range of diameters will be acceptable to the customer without causing the rod to be rejected?arrow_forwardThe force needed to break a board varies inversely with its length. If Tom uses 20 pounds of pressure to break a 1 .5-foot long board, how many pounds of pressure would he need to use to break a 6 foot long board?arrow_forward
- he Environmental Protection Agency (EPA) uses a measure called the Pollutant Standards Index (PSI) to measure air quality in a city. A PSI reading over 100 indicates a day when the air quality is considered unhealthy. The measurements represent the number of days in 1995 that the PSI was over 100 for twenty metropolitan areas in the U.S. Midwest.0, 0, 0, 1, 1, 1, 1, 1, 2, 2, 3, 4, 4, 4, 4, 5, 7, 7, 11, 14A careless employee originally recorded a number that was at least 20 times larger than 14:0, 0, 0, 1, 1, 1, 1, 1, 2, 2, 3, 4, 4, 4, 4, 5, 7, 7, 11, (much larger than 14)The employee's mistake would have the following effect:The median would stay the sameincrease decrease The mean would decreaseincrease stay the same The mode would increasestay the same decrease The IQR would increasedecrease stay the same The standard deviation would decreaseincrease stay the samearrow_forwardPrices of diamonds are determined by what is known as the 4 Cs: cut, clarity, color, and carat weight. The prices of diamonds go up as the carat weight increases, but the increase is not smooth. For example, the difference between the size of a 0.99-carat diamond and a 1-carat diamond is undetectable to the naked human eye, but the price of a 1-carat diamond tends to be much higher than the price of a 0.99 diamond. In this question, we use two random samples of diamonds, 0.99 carats and 1 carat, each sample of size 23, and compare the average prices of the diamonds. In order to be able to compare equivalent units, we first divide the price for each diamond by 100 times its weight in carats. That is, for a 0.99-carat diamond, we divide the price by 99. For a 1 carat diamond, we divide the price by 100. The distributions and some sample statistics are shown below I have attached the questions and the chart in the images section. Thank youarrow_forwardSheila's doctor is concerned that she may suffer from gestational diabetes (high blood glucose levels during pregnancy). There is variation both in the actual glucose level and in the blood test that measures the level. A patient is classified as having gestational diabetes if the glucose level is above 140 miligrams per deciliter (mg/dl) one hour after having a sugary drink. Sheila's measured glucose level one hour after the sugary drink varies according to the Normal distribution with μμ = 120 mg/dl and σσ = 10 mg/dl. (a) If a single glucose measurement is made, what is the probability that Sheila is diagnosed as having gestational diabetes?(b) If measurements are made on 5 separate days and the mean result is compared with the criterion 140 mg/dl, what is the probability that Sheila is diagnosed as having gestational diabetes?arrow_forward
- During the winter months, the temperatures at the Starneses' Colorado cabin can stay well below freezing 32°F or 0°C) for weeks at a time. To prevent the pipes from freezing, Mrs. Starnes sets the thermostat at 50°F. The manufacturer claims that the thermostat allows variation in home temperature of o = 3°F Mrs. Starnes suspects that the manufacturer is overstating the consistency of the thermostat. What are the appropriate hypotheses for performing this significance test? Ho: o = 3, H, o 3, where o = the true standard deviation of the temperature in the cabin. Ho : o = 3, H, o> 3, where o = the true standard deviation of the temperature in the cabin. Ha: o 3, where o = the true standard deviation of the temperature in the cabin. Ho: o = 3; H,: o<3, where o = the true standard deviation of the temperature in the cabin He: o < 3,H,: o2 3, where o = the true standard deviation of the temperature in the cabin. O O O O Oarrow_forwardJohn was calculating the peeds (mph) of vehicles traveling down Maple Street on two separate days at 9 am for an hour. Below is the data she collected. Wednesday's speeds: 32,28,24,17,39,44,64,33,27,21,38,40,60,30,25,37,30,25,35,30 Sunday's speeds: 18,27,34,37,49,55,63,61,48,30,27,17,17,15,26,46,25 1. Calculate the mean and median of each day. 2. Calculate the five-number summary of each day. a. Wednesday's Five-Number Summary. b. Sunday's Five-Number Summary. 3. Test each day for outliers. If they have outliers, identify them and adjust the five-number summary to reflect the outlier. (Remember to find IQR and then Upper and Lower Limits) a. Wednesday's Outlier Test b. Sunday's Outlier Test 4. Create a stacked box-and-whisker plot using the five-number summaries from Wednesday and Sunday. 5. What do you notice about the box-and-whisker plots? Describe the spread in each specifically.arrow_forwardHelp me answer the questions in the pictures with the following information below: Weatherwise is a magazine published by the American Meteorological Society. One issue gives a rating system used to classify Nor'easter storms that frequently hit New England and can cause much damage near the ocean. A severe storm has an average peak wave height of ? = 16.4 feet for waves hitting the shore. Suppose that a Nor'easter is in progress at the severe storm class rating. Peak wave heights are usually measured from land (using binoculars) off fixed cement piers. Suppose that a reading of 39 waves showed an average wave height of x = 16.7 feet. Previous studies of severe storms indicate that ? = 3.5 feet. Does this information suggest that the storm is (perhaps temporarily) increasing above the severe rating? Use ? = 0.01.arrow_forward
- Emissions of sulfur dioxide by industry set off chemical changes in the atmosphere that result in "acid rain". The acidity of liquids is measured by pH on a scale of 00 to 14.14. Distilled water has pH 7.0,7.0, and lower pH values indicate acidity. Normal rain is somewhat acidic, so acid rain is sometimes defined as rainfall with a pH below 5.0.5.0. The pH of rain at one location varies among rainy days according to a Normal distribution with mean 5.435.43 and standard deviation 0.54.deviation 0.54. What proportion of rainy days have rainfall with pH below 5.0?5.0?arrow_forwardImagine you score a x=54 on an exam. What set of parameters would give you the highest grade? A: ?= 52 and ?=2 B: ?= 50 and ?=8 C: ?= 50 ?=2 D: ?=52 and ?=8arrow_forwardSarah was calculating the speeds (mph) of vehicles travelling down Maple Street on two separate days at 9 am for an hour. Below is the data she collected. Wednesday's Speeds: 34,28,24,17,39,44,64,33,27,21,38,40,60,30,25,37,30,25,35,30 Sunday's Speeds: 18,27,34,37,49,55,63,61,48,30,27,17,17,15,26,46,25 1. Create a frequency table for each day. Make sure you look at both days when setting the intervals for your frequency table. Remember that you need to use common intervals for both days to tally the frequency. Wednesday's Frequency Table Speed Interval (mph) Sunday's Frequency Table Speed Interval (mph) Tally Tally Frequency Frequency 2. Create a histogram with appropriate labels for each day using the frequency tables you created in #1. 3. What do you notice about the two histograms? Consider the following questions: Are there any patterns in the speed distribution? Does one day look worse than the other?arrow_forward
- Algebra & Trigonometry with Analytic GeometryAlgebraISBN:9781133382119Author:SwokowskiPublisher:CengageElementary AlgebraAlgebraISBN:9780998625713Author:Lynn Marecek, MaryAnne Anthony-SmithPublisher:OpenStax - Rice University
- Holt Mcdougal Larson Pre-algebra: Student Edition...AlgebraISBN:9780547587776Author:HOLT MCDOUGALPublisher:HOLT MCDOUGALCollege AlgebraAlgebraISBN:9781305115545Author:James Stewart, Lothar Redlin, Saleem WatsonPublisher:Cengage Learning