Videos
The Witch of Agnesi
Many plane curves in mathematics are named after the people who first investigated them, like the folium of Descartes or the spiral of Archimedes. However, perhaps the strangest name for a curve is the witch of Agnesi. Why a witch?
Maria Gaetana Agnesi (1718—1799) was one of the few recognized women mathematicians of eighteenth-century Italy. She wrote a popular book on analytic geometry, published in 1748, which included an interesting curve that had been studied by Fermat in 1630. The mathematician Guido Grandi showed in 1703 how to construct this curve, which he later called the “versiera,” a Latin term for a rope used in sailing. Agnesi used the Italian term for this rope, “versiera,” but in Latin, this same word means a "female goblin.” When Agnesi’s book was translated into English in 1801, the translator used the term “witch” for the curve, instead of rope. The name “witch of Agnesi” has stuck ever since.
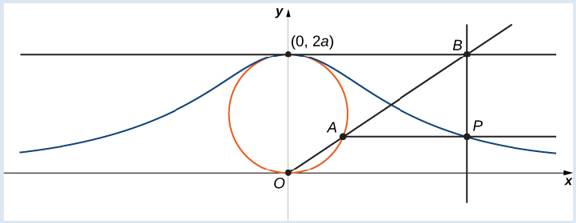
The witch of Agnesi is a curve defined as follows: Start with a Circle of radius a so that the points (0, 0) and (0, 2a) are points on the circle (Figure 7.12). Let O denote the origin. Choose any other point A on the circle, and draw the secant line OA. Let B denote the point at which the line OA intersects the horizontal line through (0, 2a). The vertical line through B intersects the horizontal line through A at the point P. As the point A varies, the path that the point P travels is the witch of Agnesi curve for the given circle.
Witch of Agnesi curves have applications in physics, including modeling water waves and distributions of spectral lines. In probability theory, the curve describes the probability density function of the Cauchy distribution. In this project you will parameterize these curves.
8. Conclude that a parameterization of the given witch curve is
Want to see the full answer?
Check out a sample textbook solution
Chapter 7 Solutions
Calculus Volume 2
Additional Math Textbook Solutions
Elementary Statistics (13th Edition)
Calculus: Early Transcendentals (2nd Edition)
A First Course in Probability (10th Edition)
Elementary Statistics: Picturing the World (7th Edition)
Thinking Mathematically (6th Edition)
A Problem Solving Approach To Mathematics For Elementary School Teachers (13th Edition)


- ۳/۱ R₂ = X2 2) slots per pole per phase 3/31 B. 180 msl Kas Sin (I) 1sin() sin(30) Sin (30) اذا ميريد شرح الكتب بس 0 بالفراغ 3) Cos (30): 0.866 4) Rotating 5) Synchronous speeds 120×50 looo G 1000-950 1000 Copper losses 5kw Rotor input 5 loo kw 0.05 6) 1 اذا ميريد شرح الكتب فقط look 7) rotor DC ined sove in peaper I need a detailed solution on paper please 0 64 Find the general solution of the following equations: QI//y(4)-16y= 0. Find the general solution of the following equations: Q2ll yll-4y/ +13y=esinx.arrow_forwardR₂ = X2 2) slots per pole per phase = 3/31 B-180 60 msl kd Kas Sin () 2 I sin (6) sin(30) Sin (30) اذا مريد شرح الكتب بس 0 بالفراغ 3 Cos (30) 0.866 4) Rotating ined sove in peaper 5) Synchronous speed s 120×50 6 s = 1000-950 1000 Copper losses 5kw Rotor input 5 0.05 6) 1 loo kw اذا ميريد شرح الكتب فقط Look 7) rotov DC I need a detailed solution on paper please 0 64 Solve the following equations: 0 Q1// Find the solution of: ( y • with y(0) = 1. dx x²+y²arrow_forwardR₂ = X2 2) slots per pole per phase = 3/3 1 B-180-60 msl Ka Sin (1) Isin () sin(30) Sin (30) اذا ميريد شرح الكتب بس 0 بالفراغ 3) Cos (30) 0.866 4) Rotating 5) Synchronous speed, 120 x 50 s = 1000-950 1000 Copper losses 5kw Rotor input 5 6) 1 0.05 G 50105 loo kw اذا ميريد شرح الكتب فقط look 7) rotov DC ined sove in peaper I need a detailed solution on paper please 064 2- A hot ball (D=15 cm ) is cooled by forced air T.-30°C, the rate of heat transfer from the ball is 460.86 W. Take for the air -0.025 Wim °C and Nu=144.89, find the ball surface temperature a) 300 °C 16 b) 327 °C c) 376 °C d) None か = 750 01arrow_forward
- Answer questions 8.3.3 and 8.3.4 respectively 8.3.4 .WP An article in Medicine and Science in Sports and Exercise [“Electrostimulation Training Effects on the Physical Performance of Ice Hockey Players” (2005, Vol. 37, pp. 455–460)] considered the use of electromyostimulation (EMS) as a method to train healthy skeletal muscle. EMS sessions consisted of 30 contractions (4-second duration, 85 Hz) and were carried out three times per week for 3 weeks on 17 ice hockey players. The 10-meter skating performance test showed a standard deviation of 0.09 seconds. Construct a 95% confidence interval of the standard deviation of the skating performance test.arrow_forward8.6.7 Consider the tire-testing data in Exercise 8.2.3. Compute a 95% tolerance interval on the life of the tires that has confidence level 95%. Compare the length of the tolerance interval with the length of the 95% CI on the population mean. Which interval is shorter? Discuss the difference in interpretation of these two intervals.arrow_forward8.6.2 Consider the natural frequency of beams described in Exercise 8.2.8. Compute a 90% prediction interval on the diameter of the natural frequency of the next beam of this type that will be tested. Compare the length of the prediction interval with the length of the 90% CI on the population mean. 8.6.3 Consider the television tube brightness test described in Exercise 8.2.7. Compute a 99% prediction interval on the brightness of the next tube tested. Compare the length of the prediction interval with the length of the 99% CI on the population mean.arrow_forward
- Answer question S8 stepwisearrow_forwardAnswer questions 8.2.11 and 8.2.12 respectivelyarrow_forward8.4.2 An article in Knee Surgery, Sports Traumatology, Arthroscopy [“Arthroscopic Meniscal Repair with an Absorbable Screw: Results and Surgical Technique” (2005, Vol. 13, pp. 273–279)] showed that only 25 out of 37 tears (67.6%) located between 3 and 6 mm from the meniscus rim were healed. a. Calculate a two-sided 95% confidence interval on the proportion of such tears that will heal. b. Calculate a 95% lower confidence bound on the proportion of such tears that will heal. 8.4.3 An article in the Journal of the American Statistical Association [“Illustration of Bayesian Inference in Normal Data Models Using Gibbs Sampling” (1990, Vol. 85, pp. 972–985)] measured the weight of 30 rats under experiment controls. Suppose that 12 were underweight rats. a. Calculate a 95% two-sided confidence interval on the true proportion of rats that would show underweight from the experiment. b. Using the point estimate of p obtained from the preliminary sample, what sample size is needed to be 95%…arrow_forward
- 8.4.8 Use the data from Exercise 8.4.2 to compute the two-sided Agresti-Coull CI on the proportion of tears that heal. Compare and discuss the relationship of this interval to the one computed in Exercise 8.4.2.arrow_forwardAnswer questions 8.3.7 and 8.4.1 respectivelyarrow_forwardDon't do 14. Please solve 19arrow_forward
 Algebra & Trigonometry with Analytic GeometryAlgebraISBN:9781133382119Author:SwokowskiPublisher:Cengage
 Mathematics For Machine TechnologyAdvanced MathISBN:9781337798310Author:Peterson, John.Publisher:Cengage Learning,
 Elementary Geometry For College Students, 7eGeometryISBN:9781337614085Author:Alexander, Daniel C.; Koeberlein, Geralyn M.Publisher:Cengage,
 Functions and Change: A Modeling Approach to Coll...AlgebraISBN:9781337111348Author:Bruce Crauder, Benny Evans, Alan NoellPublisher:Cengage Learning