
Understanding Basic Statistics
8th Edition
ISBN: 9781337558075
Author: Charles Henry Brase, Corrinne Pellillo Brase
Publisher: Cengage Learning
expand_more
expand_more
format_list_bulleted
Videos
Textbook Question
Chapter 7.1, Problem 1P
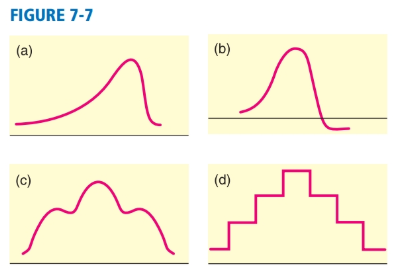
Statistical Literacy Which, if any, of the curves in Figure 7-7 look(s) like a normal curve? If a curve is not a normal curve, tell why.
Expert Solution & Answer

Trending nowThis is a popular solution!

Students have asked these similar questions
The details of the clock sales at a supermarket for the past 6 weeks are shown in the table below. The time series appears to be relatively stable, without trend, seasonal, or cyclical effects. The simple moving average value of k is set at 2. If the smoothing constant is assumed to be 0.7, and setting
F1 and F2=A1,
what is the exponential smoothing sales forecast for week 7? Round to the nearest whole number.
Week
Units sold
1
88
2
44
3
54
4
65
5
72
6
85
Question content area bottom
Part 1
A.
80 clocks
B.
60 clocks
C.
70 clocks
D.
50 clocks
The details of the clock sales at a supermarket for the past 6 weeks are shown in the table below. The time series appears to be relatively stable, without trend, seasonal, or cyclical effects. The simple moving average value of k is set at 2. Calculate the value of the simple moving average mean absolute percentage error. Round to two decimal places.
Week
Units sold
1
88
2
44
3
54
4
65
5
72
6
85
Part 1
A.
14.39
B.
25.56
C.
23.45
D.
20.90
The accompanying data shows the fossil fuels production, fossil fuels consumption, and total energy consumption in quadrillions of BTUs of a certain region for the years 1986 to 2015. Complete parts a and b.
Year Fossil Fuels Production Fossil Fuels Consumption Total Energy Consumption1949 28.748 29.002 31.9821950 32.563 31.632 34.6161951 35.792 34.008 36.9741952 34.977 33.800 36.7481953 35.349 34.826 37.6641954 33.764 33.877 36.6391955 37.364 37.410 40.2081956 39.771 38.888 41.7541957 40.133 38.926 41.7871958 37.216 38.717 41.6451959 39.045 40.550 43.4661960 39.869 42.137 45.0861961 40.307 42.758 45.7381962 41.732 44.681 47.8261963 44.037 46.509 49.6441964 45.789 48.543 51.8151965 47.235 50.577 54.0151966 50.035 53.514 57.0141967 52.597 55.127 58.9051968 54.306 58.502 62.4151969 56.286…
Chapter 7 Solutions
Understanding Basic Statistics
Ch. 7.1 - Statistical Literacy Which, if any, of the curves...Ch. 7.1 - Statistical Literacy Look at the normal curve in...Ch. 7.1 - Critical Thinking Look at the two normal curves in...Ch. 7.1 - Critical Thinking Sketch a normal curve (a) with...Ch. 7.1 - Basic Computation: Empirical Rule What percentage...Ch. 7.1 - Basic Computation: Empirical Rule What percentage...Ch. 7.1 - Distribution: Heights of Coeds Assuming that the...Ch. 7.1 - Distribution: Rhode Island Red Chicks The...Ch. 7.1 - Archaeology: Tree Rings At Burnt Mesa Pueblo,...Ch. 7.1 - Vending Machine: Soft Drinks A vending machine...
Ch. 7.1 - Pain Management: Laser Therapy Effect of...Ch. 7.1 - Expand Your knowledge: Continuous Uniform...Ch. 7.1 - Unifrom Distribution: Measurement Errors...Ch. 7.2 - Statistical Literacy What does a standard score...Ch. 7.2 - Statistical Literacy Does a raw score less than...Ch. 7.2 - Statistical Literacy What is the value of the...Ch. 7.2 - Statistical Literacy What are the values of the...Ch. 7.2 - Basic Computation: z Score and Raw Score A normal...Ch. 7.2 - Basic Computation: z Score and Raw Score A normal...Ch. 7.2 - Critical Thinking Consider the following scores:...Ch. 7.2 - Critical Thinking Raul received a score of 80 on a...Ch. 7.2 - z Scores: First Aid Course The college physical...Ch. 7.2 - z Scores: Fawns Fawns between 1 and 5 months old...Ch. 7.2 - z Scores: Red Blood Cell Count Let x = red blood...Ch. 7.2 - Normal Curve: Tree Rings Tree-ring dates were used...Ch. 7.2 - Basic Computation: Finding Areas Under the...Ch. 7.2 - Basic Computation: Finding Areas Under the...Ch. 7.2 - Basic Computation: Finding Areas Under the...Ch. 7.2 - Basic Computation: Finding Areas Under the...Ch. 7.2 - Basic Computation: Finding Areas Under the...Ch. 7.2 - Basic Computation: Finding Areas Under the...Ch. 7.2 - Basic Computation: Finding Areas Under the...Ch. 7.2 - Basic Computation: Finding Areas Under the...Ch. 7.2 - Basic Computation: Finding Areas Under the...Ch. 7.2 - Prob. 22PCh. 7.2 - Basic Computation: Finding Areas Under the...Ch. 7.2 - Basic Computation: Finding Areas Under the...Ch. 7.2 - Basic Computation: Finding Areas Under the...Ch. 7.2 - Basic Computation: Finding Areas Under the...Ch. 7.2 - Basic Computation: Finding Areas Under the...Ch. 7.2 - Basic Computation: Finding Areas Under the...Ch. 7.2 - Basic Computation: Finding Areas Under the...Ch. 7.2 - Basic Computation: Finding Areas Under the...Ch. 7.2 - Basic Computation: Finding Probabilities In...Ch. 7.2 - Basic Computation: Finding Probabilities In...Ch. 7.2 - Basic Computation: Finding Probabilities In...Ch. 7.2 - Basic Computation: Finding Probabilities In...Ch. 7.2 - Basic Computation: Finding Probabilities In...Ch. 7.2 - Basic Computation: Finding Probabilities In...Ch. 7.2 - Basic Computation: Finding Probabilities In...Ch. 7.2 - Basic Computation: Finding Probabilities In...Ch. 7.2 - Basic Computation: Finding Probabilities In...Ch. 7.2 - Basic Computation: Finding Probabilities In...Ch. 7.2 - Basic Computation: Finding Probabilities In...Ch. 7.2 - Basic Computation: Finding Probabilities In...Ch. 7.2 - Basic Computation: Finding Probabilities In...Ch. 7.2 - Basic Computation: Finding Probabilities In...Ch. 7.2 - Basic Computation: Finding Probabilities In...Ch. 7.2 - Basic Computation: Finding Probabilities In...Ch. 7.2 - Basic Computation: Finding Probabilities In...Ch. 7.2 - Basic Computation: Finding Probabilities In...Ch. 7.2 - Basic Computation: Finding Probabilities In...Ch. 7.2 - Basic Computation: Finding Probabilities In...Ch. 7.3 - Statistical Literacy Consider a normal...Ch. 7.3 - Statistical Literacy Suppose 5% of the area under...Ch. 7.3 - Statistical Literacy Suppose 5% of the area under...Ch. 7.3 - Critical Thinking: Normality Consider the...Ch. 7.3 - Basic Computation: Find Probabilities In Problems...Ch. 7.3 - Basic Computation: Find Probabilities In Problems...Ch. 7.3 - Basic Computation: Find Probabilities In Problems...Ch. 7.3 - Basic Computation: Find Probabilities In Problems...Ch. 7.3 - Basic Computation: Find Probabilities In Problems...Ch. 7.3 - Basic Computation: Find Probabilities In Problems...Ch. 7.3 - Basic Computation: Find Probabilities In Problems...Ch. 7.3 - Basic Computation: Find Probabilities In Problems...Ch. 7.3 - Basic Computation: Find Probabilities In Problems...Ch. 7.3 - Basic Computation: Find Probabilities In Problems...Ch. 7.3 - Basic Computation: Find zValues In Problems 15-24,...Ch. 7.3 - Basic Computation: Find zValues In Problems 15-24,...Ch. 7.3 - Basic Computation: Find zValues In Problems 15-24,...Ch. 7.3 - Basic Computation: Find zValues In Problems 15-24,...Ch. 7.3 - Basic Computation: Find zValues In Problems 15-24,...Ch. 7.3 - Basic Computation: Find zValues In Problems 15-24,...Ch. 7.3 - Basic Computation: Find zValues In Problems 15-24,...Ch. 7.3 - Basic Computation: Find zValues In Problems 15-24,...Ch. 7.3 - Basic Computation: Find zValues In Problems 15-24,...Ch. 7.3 - Basic Computation: Find zValues In Problems 15-24,...Ch. 7.3 - Medical: Blood Glucose A person's blood glucose...Ch. 7.3 - Medical: Blood Protoplasm Porphyrin is a pigment...Ch. 7.3 - 27 Archaeology: Hopi Village Thickness...Ch. 7.3 - Law Enforcement: Police Response Time Police...Ch. 7.3 - Guarantee: Batteries Quick Start Company makes...Ch. 7.3 - Guarantee: Watches Accrotime is a manufacturer of...Ch. 7.3 - Expand Your Knowledge: Estimating the Standard...Ch. 7.3 - Estimating the Standard Deviation: Refrigerator...Ch. 7.3 - Estimating the Standard Deviation: Veterinary...Ch. 7.3 - Estimating the Standard Deviation: Veterinary...Ch. 7.3 - Insurance: Satellites A relay microchip in a...Ch. 7.4 - Statistical Literacy What is a population? Give...Ch. 7.4 - Statistical Literac y What is a random sample from...Ch. 7.4 - Statistical Literacy What is a population...Ch. 7.4 - Statistical Literacy What is a sample statistic?...Ch. 7.4 - Statistical Literacy What is the meaning of the...Ch. 7.4 - Statistical Literacy What is a sampling...Ch. 7.4 - Critical Thinking How do frequency tables,...Ch. 7.4 - Critical Thinking How can relative frequencies be...Ch. 7.4 - Critical Thinking Give an example of a specific...Ch. 7.5 - Statistical Literacy What is the standard error of...Ch. 7.5 - Statistical Literacy What is the standard...Ch. 7.5 - Statistical Literacy List two unbiased estimators...Ch. 7.5 - Statistical Literacy Describe how the variability...Ch. 7.5 - Basic Computation: Central Limit Theorem Suppose x...Ch. 7.5 - Basic Computation: Central Limit Theorem Suppose x...Ch. 7.5 - Prob. 7PCh. 7.5 - Critical Thinking Suppose x has a distribution...Ch. 7.5 - Critical Thinking Consider two x distributions...Ch. 7.5 - Critical Thinking Consider an x distribution with...Ch. 7.5 - Critical Thinking Suppose x has a distribution...Ch. 7.5 - Critical Thinking Suppose an x distribution has...Ch. 7.5 - Coal: Automatic Loader Coal is carried from a mine...Ch. 7.5 - Vital Statistics: Heights of Men The heights of...Ch. 7.5 - Medical: Blood Glucose Let x be a random variable...Ch. 7.5 - Medical: White Blood Cells Let x be a random...Ch. 7.5 - Wildlife: Deer Let x be a random variable that...Ch. 7.5 - Focus Problem: Impulse Buying Let x represent the...Ch. 7.5 - Finance: Templeton Funds Templeton world is a...Ch. 7.5 - Finance: European Growth Fund A European growth...Ch. 7.6 - Statistical Literacy Binomial probability...Ch. 7.6 - Statistical Literacy When we use a normal...Ch. 7.6 - Basic Computation: Normal Approximation to a...Ch. 7.6 - Basic Computation: Normal Approximation to a...Ch. 7.6 - Critical Thinking You need to compute the...Ch. 7.6 - Critical Thinking Consider a binomial experiment...Ch. 7.6 - In the following problems, check that it is...Ch. 7.6 - Insurance: Claims Do you try to pad an insurance...Ch. 7.6 - Longevity: 90th Birthday It is estimated that 3.5%...Ch. 7.6 - Fishing: Billfish Ocean fishing for billfish is...Ch. 7.6 - Grocery Stores: New ProductsThe Denver Post slated...Ch. 7.6 - Crime: Murder What are the chances that a person...Ch. 7.6 - Supermarkets: Free Samples Do you take the free...Ch. 7.6 - Ice Cream: Flavors Whats your favorite ice cream...Ch. 7.6 - Airline Flights: No-Shows Based on long...Ch. 7.6 - 16. General: Approximations We have studied the...Ch. 7.6 - Statistical Literacy Under what conditions is it...Ch. 7.6 - Statistical Literacy What is the formula for the...Ch. 7.6 - Statistical Literacy Is p an unbiased estimator...Ch. 7.6 - Basic Computation: p Distribution Suppose we have...Ch. 7.6 - Basic Computation: p Distribution Suppose we have...Ch. 7 - Terminology Consider the graph of a normal...Ch. 7 - Terminology What are the values of the mean and...Ch. 7 - Terminology Answer the following statements...Ch. 7 - Terminology Consider all possible random samples...Ch. 7 - Statistical Literacy Describe a normal probability...Ch. 7 - Statistical Literacy According to the empirical...Ch. 7 - Statistical Literacy Random sample of size 9 is...Ch. 7 - Statistical Literacy Can a normal distribution...Ch. 7 - Statistical Literacy What characteristic of a...Ch. 7 - Statistical Liter acy For a normal distribution,...Ch. 7 - Statistical Literacy Give the formula for the...Ch. 7 - Statistical Literacy Give the formula for the...Ch. 7 - Critical Thinking Let x be a random variable...Ch. 7 - Critical Thinking If x has a normal distribution...Ch. 7 - Basic Computation: Probability Given that x is a...Ch. 7 - Basic Computation: Probability Given that x is a...Ch. 7 - Basic Computation: Inverse Normal Find z such that...Ch. 7 - Basic Computation: Inverse Normal Find z such that...Ch. 7 - Medical: Blood Type Blood type AB is found in only...Ch. 7 - Customer Complaints: Time The Customer Service...Ch. 7 - 21. Recycling: Aluminum Cans One environmental...Ch. 7 - 22. Guarantee: Battery Life Many people consider...Ch. 7 - Guarantee: Package Delivery Express Courier...Ch. 7 - Drugs: Effects A new muscle relaxant is available....Ch. 7 - Psychology: IQ Scores Assume that IQ scores are...Ch. 7 - Hatchery Fish: Length A large tank of fish from a...Ch. 7 - Basic Computation: p Distribution Suppose we have...Ch. 7 - Green Behavior: Purchasing Habits A recent Harris...Ch. 7 - Iris setosa is a beautiful wildflower that is...Ch. 7 - If you look up the word empirical in a dictionary,...Ch. 7 - Why are standard z values so important? Is it true...Ch. 7 - Most people would agree that increased information...Ch. 7 - In a way, the central limit theorem can be thought...
Knowledge Booster


Learn more about
Need a deep-dive on the concept behind this application? Look no further. Learn more about this topic, statistics and related others by exploring similar questions and additional content below.Similar questions
- The accompanying data shows the fossil fuels production, fossil fuels consumption, and total energy consumption in quadrillions of BTUs of a certain region for the years 1986 to 2015. Complete parts a and b. Year Fossil Fuels Production Fossil Fuels Consumption Total Energy Consumption1949 28.748 29.002 31.9821950 32.563 31.632 34.6161951 35.792 34.008 36.9741952 34.977 33.800 36.7481953 35.349 34.826 37.6641954 33.764 33.877 36.6391955 37.364 37.410 40.2081956 39.771 38.888 41.7541957 40.133 38.926 41.7871958 37.216 38.717 41.6451959 39.045 40.550 43.4661960 39.869 42.137 45.0861961 40.307 42.758 45.7381962 41.732 44.681 47.8261963 44.037 46.509 49.6441964 45.789 48.543 51.8151965 47.235 50.577 54.0151966 50.035 53.514 57.0141967 52.597 55.127 58.9051968 54.306 58.502 62.4151969 56.286…arrow_forwardThe accompanying data shows the fossil fuels production, fossil fuels consumption, and total energy consumption in quadrillions of BTUs of a certain region for the years 1986 to 2015. Complete parts a and b. Develop line charts for each variable and identify the characteristics of the time series (that is, random, stationary, trend, seasonal, or cyclical). What is the line chart for the variable Fossil Fuels Production?arrow_forwardThe accompanying data shows the fossil fuels production, fossil fuels consumption, and total energy consumption in quadrillions of BTUs of a certain region for the years 1986 to 2015. Complete parts a and b. Year Fossil Fuels Production Fossil Fuels Consumption Total Energy Consumption1949 28.748 29.002 31.9821950 32.563 31.632 34.6161951 35.792 34.008 36.9741952 34.977 33.800 36.7481953 35.349 34.826 37.6641954 33.764 33.877 36.6391955 37.364 37.410 40.2081956 39.771 38.888 41.7541957 40.133 38.926 41.7871958 37.216 38.717 41.6451959 39.045 40.550 43.4661960 39.869 42.137 45.0861961 40.307 42.758 45.7381962 41.732 44.681 47.8261963 44.037 46.509 49.6441964 45.789 48.543 51.8151965 47.235 50.577 54.0151966 50.035 53.514 57.0141967 52.597 55.127 58.9051968 54.306 58.502 62.4151969 56.286…arrow_forward
- For each of the time series, construct a line chart of the data and identify the characteristics of the time series (that is, random, stationary, trend, seasonal, or cyclical). Month PercentApr 1972 4.97May 1972 5.00Jun 1972 5.04Jul 1972 5.25Aug 1972 5.27Sep 1972 5.50Oct 1972 5.73Nov 1972 5.75Dec 1972 5.79Jan 1973 6.00Feb 1973 6.02Mar 1973 6.30Apr 1973 6.61May 1973 7.01Jun 1973 7.49Jul 1973 8.30Aug 1973 9.23Sep 1973 9.86Oct 1973 9.94Nov 1973 9.75Dec 1973 9.75Jan 1974 9.73Feb 1974 9.21Mar 1974 8.85Apr 1974 10.02May 1974 11.25Jun 1974 11.54Jul 1974 11.97Aug 1974 12.00Sep 1974 12.00Oct 1974 11.68Nov 1974 10.83Dec 1974 10.50Jan 1975 10.05Feb 1975 8.96Mar 1975 7.93Apr 1975 7.50May 1975 7.40Jun 1975 7.07Jul 1975 7.15Aug 1975 7.66Sep 1975 7.88Oct 1975 7.96Nov 1975 7.53Dec 1975 7.26Jan 1976 7.00Feb 1976 6.75Mar 1976 6.75Apr 1976 6.75May 1976…arrow_forwardHi, I need to make sure I have drafted a thorough analysis, so please answer the following questions. Based on the data in the attached image, develop a regression model to forecast the average sales of football magazines for each of the seven home games in the upcoming season (Year 10). That is, you should construct a single regression model and use it to estimate the average demand for the seven home games in Year 10. In addition to the variables provided, you may create new variables based on these variables or based on observations of your analysis. Be sure to provide a thorough analysis of your final model (residual diagnostics) and provide assessments of its accuracy. What insights are available based on your regression model?arrow_forwardI want to make sure that I included all possible variables and observations. There is a considerable amount of data in the images below, but not all of it may be useful for your purposes. Are there variables contained in the file that you would exclude from a forecast model to determine football magazine sales in Year 10? If so, why? Are there particular observations of football magazine sales from previous years that you would exclude from your forecasting model? If so, why?arrow_forward
- Stat questionsarrow_forward1) and let Xt is stochastic process with WSS and Rxlt t+t) 1) E (X5) = \ 1 2 Show that E (X5 = X 3 = 2 (= = =) Since X is WSSEL 2 3) find E(X5+ X3)² 4) sind E(X5+X2) J=1 ***arrow_forwardProve that 1) | RxX (T) | << = (R₁ " + R$) 2) find Laplalse trans. of Normal dis: 3) Prove thy t /Rx (z) | < | Rx (0)\ 4) show that evary algebra is algebra or not.arrow_forward
- For each of the time series, construct a line chart of the data and identify the characteristics of the time series (that is, random, stationary, trend, seasonal, or cyclical). Month Number (Thousands)Dec 1991 65.60Jan 1992 71.60Feb 1992 78.80Mar 1992 111.60Apr 1992 107.60May 1992 115.20Jun 1992 117.80Jul 1992 106.20Aug 1992 109.90Sep 1992 106.00Oct 1992 111.80Nov 1992 84.50Dec 1992 78.60Jan 1993 70.50Feb 1993 74.60Mar 1993 95.50Apr 1993 117.80May 1993 120.90Jun 1993 128.50Jul 1993 115.30Aug 1993 121.80Sep 1993 118.50Oct 1993 123.30Nov 1993 102.30Dec 1993 98.70Jan 1994 76.20Feb 1994 83.50Mar 1994 134.30Apr 1994 137.60May 1994 148.80Jun 1994 136.40Jul 1994 127.80Aug 1994 139.80Sep 1994 130.10Oct 1994 130.60Nov 1994 113.40Dec 1994 98.50Jan 1995 84.50Feb 1995 81.60Mar 1995 103.80Apr 1995 116.90May 1995 130.50Jun 1995 123.40Jul 1995 129.10Aug 1995…arrow_forwardFor each of the time series, construct a line chart of the data and identify the characteristics of the time series (that is, random, stationary, trend, seasonal, or cyclical). Year Month Units1 Nov 42,1611 Dec 44,1862 Jan 42,2272 Feb 45,4222 Mar 54,0752 Apr 50,9262 May 53,5722 Jun 54,9202 Jul 54,4492 Aug 56,0792 Sep 52,1772 Oct 50,0872 Nov 48,5132 Dec 49,2783 Jan 48,1343 Feb 54,8873 Mar 61,0643 Apr 53,3503 May 59,4673 Jun 59,3703 Jul 55,0883 Aug 59,3493 Sep 54,4723 Oct 53,164arrow_forwardHigh Cholesterol: A group of eight individuals with high cholesterol levels were given a new drug that was designed to lower cholesterol levels. Cholesterol levels, in milligrams per deciliter, were measured before and after treatment for each individual, with the following results: Individual Before 1 2 3 4 5 6 7 8 237 282 278 297 243 228 298 269 After 200 208 178 212 174 201 189 185 Part: 0/2 Part 1 of 2 (a) Construct a 99.9% confidence interval for the mean reduction in cholesterol level. Let a represent the cholesterol level before treatment minus the cholesterol level after. Use tables to find the critical value and round the answers to at least one decimal place.arrow_forward
arrow_back_ios
SEE MORE QUESTIONS
arrow_forward_ios
Recommended textbooks for you
 Big Ideas Math A Bridge To Success Algebra 1: Stu...AlgebraISBN:9781680331141Author:HOUGHTON MIFFLIN HARCOURTPublisher:Houghton Mifflin Harcourt
 Holt Mcdougal Larson Pre-algebra: Student Edition...AlgebraISBN:9780547587776Author:HOLT MCDOUGALPublisher:HOLT MCDOUGAL
 Glencoe Algebra 1, Student Edition, 9780079039897...AlgebraISBN:9780079039897Author:CarterPublisher:McGraw Hill
 Algebra and Trigonometry (MindTap Course List)AlgebraISBN:9781305071742Author:James Stewart, Lothar Redlin, Saleem WatsonPublisher:Cengage Learning
 College AlgebraAlgebraISBN:9781305115545Author:James Stewart, Lothar Redlin, Saleem WatsonPublisher:Cengage Learning
 Functions and Change: A Modeling Approach to Coll...AlgebraISBN:9781337111348Author:Bruce Crauder, Benny Evans, Alan NoellPublisher:Cengage Learning
Big Ideas Math A Bridge To Success Algebra 1: Stu...
Algebra
ISBN:9781680331141
Author:HOUGHTON MIFFLIN HARCOURT
Publisher:Houghton Mifflin Harcourt
Holt Mcdougal Larson Pre-algebra: Student Edition...
Algebra
ISBN:9780547587776
Author:HOLT MCDOUGAL
Publisher:HOLT MCDOUGAL
Glencoe Algebra 1, Student Edition, 9780079039897...
Algebra
ISBN:9780079039897
Author:Carter
Publisher:McGraw Hill
Algebra and Trigonometry (MindTap Course List)
Algebra
ISBN:9781305071742
Author:James Stewart, Lothar Redlin, Saleem Watson
Publisher:Cengage Learning
College Algebra
Algebra
ISBN:9781305115545
Author:James Stewart, Lothar Redlin, Saleem Watson
Publisher:Cengage Learning
Functions and Change: A Modeling Approach to Coll...
Algebra
ISBN:9781337111348
Author:Bruce Crauder, Benny Evans, Alan Noell
Publisher:Cengage Learning
Graph Theory: Euler Paths and Euler Circuits; Author: Mathispower4u;https://www.youtube.com/watch?v=5M-m62qTR-s;License: Standard YouTube License, CC-BY
WALK,TRIAL,CIRCUIT,PATH,CYCLE IN GRAPH THEORY; Author: DIVVELA SRINIVASA RAO;https://www.youtube.com/watch?v=iYVltZtnAik;License: Standard YouTube License, CC-BY