
Engineering Economy Plus Mylab Engineering With Pe Format: Cloth Bound With Access Card
17th Edition
ISBN: 9780134873206
Author: Sullivan, William G.^wicks, Elin M.^koelling, C. P
Publisher: Prentice Hall
expand_more
expand_more
format_list_bulleted
Videos
Textbook Question
Chapter 7, Problem 85FE
Two insulation thickness alternatives have been proposed for a process steam line subject to severe weather conditions. One alternative must be selected. The estimated installed cost and annual energy savings in heat loss are given below.
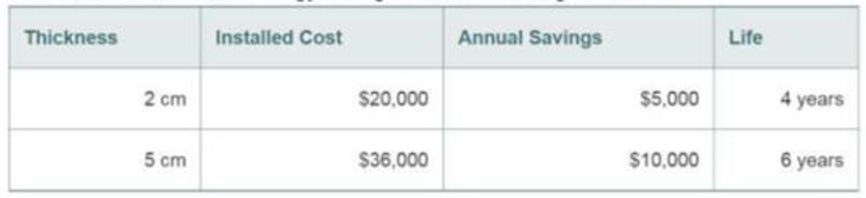
Which thickness would you recommend for an after-tax MARR of 10% per year and negligible salvage value? Straight-line
- a. Do nothing
- b. 2 cm
- c. 5 cm
Expert Solution & Answer
Want to see the full answer?
Check out a sample textbook solution
Students have asked these similar questions
Not use ai please let
Consider the market for sweaters in a Hamilton
neighbourhood shown in the figure to the right. The
consumer surplus generated by consuming the 29th
sweater is
OA. $67.90.
OB. $58.20.
○ C. $77.60.
OD. $38.80.
○ E. $19.50.
Price ($)
97
68.0
48.5
29.0
29.0
Sweater Market
48.5
Quantity (Sweaters per week)
Not use ai please
Chapter 7 Solutions
Engineering Economy Plus Mylab Engineering With Pe Format: Cloth Bound With Access Card
Ch. 7 - How are depreciation deductions different from...Ch. 7 - Prob. 2PCh. 7 - Explain the difference between real and personal...Ch. 7 - Prob. 4PCh. 7 - Prob. 5PCh. 7 - Prob. 6PCh. 7 - Prob. 7PCh. 7 - Prob. 8PCh. 7 - Prob. 9PCh. 7 - Prob. 10P
Ch. 7 - Prob. 11PCh. 7 - Prob. 12PCh. 7 - Prob. 13PCh. 7 - Prob. 14PCh. 7 - A manufacturer of aerospace products purchased...Ch. 7 - Prob. 16PCh. 7 - Prob. 17PCh. 7 - Prob. 18PCh. 7 - Prob. 19PCh. 7 - Prob. 20PCh. 7 - Prob. 21PCh. 7 - Prob. 22PCh. 7 - Prob. 23PCh. 7 - Prob. 24PCh. 7 - Prob. 25PCh. 7 - Prob. 26PCh. 7 - Prob. 27PCh. 7 - Prob. 28PCh. 7 - Prob. 29PCh. 7 - Prob. 30PCh. 7 - Prob. 31PCh. 7 - Prob. 32PCh. 7 - Prob. 33PCh. 7 - Refer to Problem 6-79. The alternatives all have a...Ch. 7 - Prob. 35PCh. 7 - Prob. 36PCh. 7 - Prob. 37PCh. 7 - Prob. 38PCh. 7 - Prob. 39PCh. 7 - Prob. 40PCh. 7 - Prob. 41PCh. 7 - Prob. 42PCh. 7 - Prob. 43PCh. 7 - Prob. 44PCh. 7 - Prob. 45PCh. 7 - Prob. 46PCh. 7 - AMT, Inc., is considering the purchase of a...Ch. 7 - Prob. 48PCh. 7 - Prob. 49PCh. 7 - Prob. 50PCh. 7 - Prob. 51PCh. 7 - Prob. 52PCh. 7 - Determine the after-tax yield (i.e., IRR on the...Ch. 7 - A 529-state-approved Individual Retirement Account...Ch. 7 - Prob. 55PCh. 7 - Prob. 56PCh. 7 - Prob. 57SECh. 7 - Prob. 58SECh. 7 - Prob. 59SECh. 7 - Refer to the chapter opener and Example 7-14. As...Ch. 7 - Prob. 61FECh. 7 - The Parkview Hospital is considering the purchase...Ch. 7 - Prob. 63FECh. 7 - Prob. 64FECh. 7 - Prob. 65FECh. 7 - Prob. 66FECh. 7 - Prob. 67FECh. 7 - Prob. 68FECh. 7 - Prob. 69FECh. 7 - Prob. 70FECh. 7 - Prob. 71FECh. 7 - Prob. 72FECh. 7 - Prob. 73FECh. 7 - Prob. 74FECh. 7 - Prob. 75FECh. 7 - If the federal income tax rate is 35% and the...Ch. 7 - Prob. 77FECh. 7 - Acme Manufacturing makes their preliminary...Ch. 7 - Prob. 79FECh. 7 - Prob. 80FECh. 7 - Prob. 81FECh. 7 - Prob. 82FECh. 7 - Prob. 83FECh. 7 - Prob. 84FECh. 7 - Two insulation thickness alternatives have been...
Knowledge Booster


Learn more about
Need a deep-dive on the concept behind this application? Look no further. Learn more about this topic, economics and related others by exploring similar questions and additional content below.Similar questions
- In the following table, complete the third column by determining the quantity sold in each country at a price of $18 per toy train. Next, complete the fourth column by calculating the total profit and the profit from each country under a single price. Price Single Price Quantity Sold Price Discrimination Country (Dollars per toy train) (Millions of toy trains) Profit (Millions of dollars) Price (Dollars per toy train) Quantity Sold (Millions of toy trains) Profit (Millions of dollars) France 18 Russia 18 Total N/A N/A N/A N/A Suppose that as a profit-maximizing firm, Le Jouet decides to price discriminate by charging a different price in each market, while its marginal cost of production remains $8 per toy. Complete the last three columns in the previous table by determining the profit-maximizing price, the quantity sold at that price, the profit in each country, and total profit if Le Jouet price discriminates. Le Jouet charges a lower price in the market with a relatively elastic…arrow_forwardNot use ai pleasearrow_forwardNot dhdjdjdjduudnxnxjfjfi feverarrow_forward
- Discuss the different types of resources (natural, human, capital) and how they are allocated in an economy. Identify which resources are scarce and which are abundant, and explain the implications of this scarcity or abundance.arrow_forwardNot use ai pleasearrow_forwardNot use ai please letarrow_forward
- Location should be in GWAGWALADA Abuja Nigeria Use the Internet to do itarrow_forwardUsing data from 1988 for houses sold in Andover, Massachusetts, from Kiel and McClain (1995), the following equation relates housing price (price) to the distance from a recently built garbage incinerator (dist): = log(price) 9.40 + 0.312 log(dist) n = 135, R2 = 0.162. Interpretation of the slope coefficient? ► How would our interpretation of the slope coefficient change if distance were measured in metres instead of kilometres?arrow_forwardIf GDP goes up by 1% and the investment component of GDPgoes up by more than 1%, how is the investment share ofGDP changing in absolute terms?▶ In economics, what else is expressed as relative percentagechanges?arrow_forward
- CEO Salary and Firm SalesWe can estimate a constant elasticity model relating CEO salary to firm sales. The data set is the same one used in Example 2.3, except we now relate salary to sales. Let sales be annual firm sales, measured in millions of dollars. A constant elasticity model is[2.45]ßßlog (salary) = ß0 + ß0log (sales) + u,where ß1 is the elasticity of salary with respect to sales. This model falls under the simple regression model by defining the dependent variable to be y = log(salary) and the independent variable to be x = log1sales2. Estimating this equation by OLS gives[2.46]log (salary)^=4.822 + 0.257 (sales) n = 209, R2 = 0.211.The coefficient of log(sales) is the estimated elasticity of salary with respect to sales. It implies that a 1% increase in firm sales increases CEO salary by about 0.257%—the usual interpretation of an elasticity.arrow_forwardSolvearrow_forwardAsap please and give with explanation with each steparrow_forward
arrow_back_ios
SEE MORE QUESTIONS
arrow_forward_ios
Recommended textbooks for you
 Managerial Economics: Applications, Strategies an...EconomicsISBN:9781305506381Author:James R. McGuigan, R. Charles Moyer, Frederick H.deB. HarrisPublisher:Cengage Learning
 Microeconomics: Private and Public Choice (MindTa...EconomicsISBN:9781305506893Author:James D. Gwartney, Richard L. Stroup, Russell S. Sobel, David A. MacphersonPublisher:Cengage Learning
 Economics: Private and Public Choice (MindTap Cou...EconomicsISBN:9781305506725Author:James D. Gwartney, Richard L. Stroup, Russell S. Sobel, David A. MacphersonPublisher:Cengage Learning
 Managerial Economics: A Problem Solving ApproachEconomicsISBN:9781337106665Author:Luke M. Froeb, Brian T. McCann, Michael R. Ward, Mike ShorPublisher:Cengage Learning
Managerial Economics: Applications, Strategies an...
Economics
ISBN:9781305506381
Author:James R. McGuigan, R. Charles Moyer, Frederick H.deB. Harris
Publisher:Cengage Learning
Microeconomics: Private and Public Choice (MindTa...
Economics
ISBN:9781305506893
Author:James D. Gwartney, Richard L. Stroup, Russell S. Sobel, David A. Macpherson
Publisher:Cengage Learning
Economics: Private and Public Choice (MindTap Cou...
Economics
ISBN:9781305506725
Author:James D. Gwartney, Richard L. Stroup, Russell S. Sobel, David A. Macpherson
Publisher:Cengage Learning
Managerial Economics: A Problem Solving Approach
Economics
ISBN:9781337106665
Author:Luke M. Froeb, Brian T. McCann, Michael R. Ward, Mike Shor
Publisher:Cengage Learning
DATA GEMS: How to Access Income Data Tables and Reports From the CPS ASEC; Author: U.S. Census Bureau;https://www.youtube.com/watch?v=BWpVC-Clczw;License: Standard Youtube License