
Videos
Use the following questions to check your understanding of some of the many types of visual information used in astronomy. For additional practice, try the Chapter 7 Visual Quiz at Mastering Astronomy.
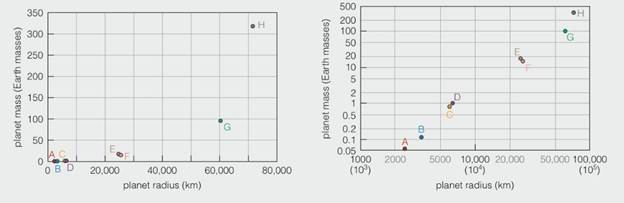
The plots above show the masses of the eight major planets on the vertical axis and their radial on the horizontal axis. The plot on the left shows the information on a linear scale, meaning that each tick mark indicates an increase by the same amount. The plot on the right shows the same information plotted on an exponential scale, meaning that each tick mark represents another actor-of-ten increase. Before proceeding, convince yourself that the points on each plot are the same.
4. Answer each of the following questions to compare the two plots.
a. Which plot, if either, best shows mass and radius information for all the planets?
b. Which plot, if either, best emphasizes the differences between Jupiter and Saturn?
c. Which plot, if either, could most easily be extended to show a planet with twice Jupiter's mass or radius?
Want to see the full answer?
Check out a sample textbook solution
Chapter 7 Solutions
EBK THE COSMIC PERSPECTIVE


- Which of the following best describes how to calculate the average acceleration of any object? Average acceleration is always halfway between the initial acceleration of an object and its final acceleration. Average acceleration is always equal to the change in velocity of an object divided by the time interval. Average acceleration is always equal to the displacement of an object divided by the time interval. Average acceleration is always equal to the change in speed of an object divided by the time interval.arrow_forwardThe figure shows the velocity versus time graph for a car driving on a straight road. Which of the following best describes the acceleration of the car? v (m/s) t(s) The acceleration of the car is negative and decreasing. The acceleration of the car is constant. The acceleration of the car is positive and increasing. The acceleration of the car is positive and decreasing. The acceleration of the car is negative and increasing.arrow_forwardWhich figure could represent the velocity versus time graph of a motorcycle whose speed is increasing? v (m/s) v (m/s) t(s) t(s)arrow_forward
- Unlike speed, velocity is a the statement? Poisition. Direction. Vector. Scalar. quantity. Which one of the following completesarrow_forwardNo chatgpt pls will upvote Already got wrong chatgpt answerarrow_forward3.63 • Leaping the River II. A physics professor did daredevil stunts in his spare time. His last stunt was an attempt to jump across a river on a motorcycle (Fig. P3.63). The takeoff ramp was inclined at 53.0°, the river was 40.0 m wide, and the far bank was 15.0 m lower than the top of the ramp. The river itself was 100 m below the ramp. Ignore air resistance. (a) What should his speed have been at the top of the ramp to have just made it to the edge of the far bank? (b) If his speed was only half the value found in part (a), where did he land? Figure P3.63 53.0° 100 m 40.0 m→ 15.0 marrow_forward
 AstronomyPhysicsISBN:9781938168284Author:Andrew Fraknoi; David Morrison; Sidney C. WolffPublisher:OpenStax
 Stars and GalaxiesPhysicsISBN:9781305120785Author:Michael A. Seeds, Dana BackmanPublisher:Cengage Learning
 Glencoe Physics: Principles and Problems, Student...PhysicsISBN:9780078807213Author:Paul W. ZitzewitzPublisher:Glencoe/McGraw-Hill
 Foundations of Astronomy (MindTap Course List)PhysicsISBN:9781337399920Author:Michael A. Seeds, Dana BackmanPublisher:Cengage Learning
 Stars and Galaxies (MindTap Course List)PhysicsISBN:9781337399944Author:Michael A. SeedsPublisher:Cengage Learning