Use the following questions to check your understanding of some of the many types of visual information used in astronomy. For additional practice, try the Chapter 7 Visual Quiz at Mastering Astronomy.
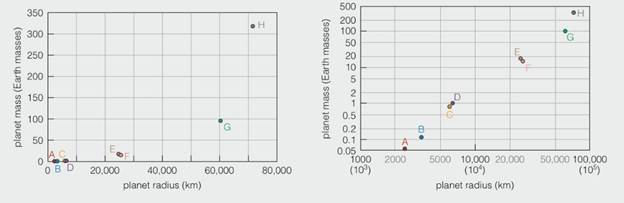
The plots above show the masses of the eight major planets on the vertical axis and their radial on the horizontal axis. The plot on the left shows the information on a linear scale, meaning that each tick mark indicates an increase by the same amount. The plot on the right shows the same information plotted on an exponential scale, meaning that each tick mark represents another actor-of-ten increase. Before proceeding, convince yourself that the points on each plot are the same.
3. Which statements most accurately describes the relationship between the largest and smallest planets?
a. The largest planet is 6000 times as wide (in diameter) and 30 times as massive as the smallest.
b. The largest planet is 6000 times as wide (in diameter) and 6000 times as massive as the smallest.
c. The largest planet is 30 times as wide (in diameter) and 30 times as massive as the smallest.
d. The largest planet is 30 times as wide (in diameter) and 6000 times as massive as the smallest.
![Check Mark](/static/check-mark.png)
Want to see the full answer?
Check out a sample textbook solution![Blurred answer](/static/blurred-answer.jpg)
Chapter 7 Solutions
EBK THE COSMIC PERSPECTIVE
- A ball is thrown with an initial speed v, at an angle 6, with the horizontal. The horizontal range of the ball is R, and the ball reaches a maximum height R/4. In terms of R and g, find the following. (a) the time interval during which the ball is in motion 2R (b) the ball's speed at the peak of its path v= Rg 2 √ sin 26, V 3 (c) the initial vertical component of its velocity Rg sin ei sin 20 (d) its initial speed Rg √ sin 20 × (e) the angle 6, expressed in terms of arctan of a fraction. 1 (f) Suppose the ball is thrown at the same initial speed found in (d) but at the angle appropriate for reaching the greatest height that it can. Find this height. hmax R2 (g) Suppose the ball is thrown at the same initial speed but at the angle for greatest possible range. Find this maximum horizontal range. Xmax R√3 2arrow_forwardAn outfielder throws a baseball to his catcher in an attempt to throw out a runner at home plate. The ball bounces once before reaching the catcher. Assume the angle at which the bounced ball leaves the ground is the same as the angle at which the outfielder threw it as shown in the figure, but that the ball's speed after the bounce is one-half of what it was before the bounce. 8 (a) Assuming the ball is always thrown with the same initial speed, at what angle & should the fielder throw the ball to make it go the same distance D with one bounce (blue path) as a ball thrown upward at 35.0° with no bounce (green path)? 24 (b) Determine the ratio of the time interval for the one-bounce throw to the flight time for the no-bounce throw. Cone-bounce no-bounce 0.940arrow_forwardA rocket is launched at an angle of 60.0° above the horizontal with an initial speed of 97 m/s. The rocket moves for 3.00 s along its initial line of motion with an acceleration of 28.0 m/s². At this time, its engines fail and the rocket proceeds to move as a projectile. (a) Find the maximum altitude reached by the rocket. 1445.46 Your response differs from the correct answer by more than 10%. Double check your calculations. m (b) Find its total time of flight. 36.16 x Your response is within 10% of the correct value. This may be due to roundoff error, or you could have a mistake in your calculation. Carry out all intermediate results to at least four-digit accuracy to minimize roundoff error. s (c) Find its horizontal range. 1753.12 × Your response differs from the correct answer by more than 10%. Double check your calculations. marrow_forward
- Race car driver is cruising down the street at a constant speed of 28.9 m/s (~65 mph; he has a “lead” foot) when the traffic light in front of him turns red. a) If the driver’s reaction time is 160 ms, how far does he and his car travel down the road from the instant he sees the light change to the instant he begins to slow down? b) If the driver’s combined reaction and movement time is 750 ms, how far do he and his car travel down the road from the instant he sees the light change to the instant he slams on her brakes and car begins to slow down? Please answer parts a-B. Show all work. For each question draw a diagram to show the vector/s. Show all the step and provide units in the answers. Provide answer to 2 decimal places. DONT FORGET TO DRAW VECTORS! ONLY USE BASIC FORMULAS TAUGHT IN PHYSICS. distance = speed * time.arrow_forwardRace car driver is cruising down the street at a constant speed of 28.9 m/s (~65 mph; he has a “lead” foot) when the traffic light in front of him turns red. a) If the driver’s reaction time is 160 ms, how far does he and his car travel down the road from the instant he sees the light change to the instant he begins to slow down? b) If the driver’s combined reaction and movement time is 750 ms, how far do he and his car travel down the road from the instant he sees the light change to the instant he slams on her brakes and car begins to slow down? c) If the driver’s average rate of acceleration is -9.5 m/s2 as he slows down, how long does it take him to come to a stop (use information about his speed of 28.9 m/s but do NOT use his reaction and movement time in this computation)? Please answer parts a-c. Show all work. For each question draw a diagram to show the vector/s. Show all the step and provide units in the answers. Provide answer to 2 decimal places unless stated otherwise.…arrow_forwardHow is it that part a is connected to part b? I can't seem to solve either part and don't see the connection between the two.arrow_forward
- Hello, please help with inputing trial one into the equation, I just need a model for the first one so I can answer the rest. Also, does my data have the correct sigfig? Thanks!arrow_forwardFind the current in the R₁ resistor in the drawing (V₁=16.0V, V2=23.0 V, V₂ = 16.0V, R₁ = 2005, R₂ = and R₂ = 2.705) 2.3052 VIT A www R www R₂ R₂ Vaarrow_forwardWhich of the following laws is true regarding tensile strength? • tensile strength T ①Fbreak = Wtfest Piece thickness rate (mm) ②T = test piece width rabe (mm) Fbreak break watarrow_forward
- AstronomyPhysicsISBN:9781938168284Author:Andrew Fraknoi; David Morrison; Sidney C. WolffPublisher:OpenStaxStars and GalaxiesPhysicsISBN:9781305120785Author:Michael A. Seeds, Dana BackmanPublisher:Cengage Learning
- Glencoe Physics: Principles and Problems, Student...PhysicsISBN:9780078807213Author:Paul W. ZitzewitzPublisher:Glencoe/McGraw-HillFoundations of Astronomy (MindTap Course List)PhysicsISBN:9781337399920Author:Michael A. Seeds, Dana BackmanPublisher:Cengage LearningStars and Galaxies (MindTap Course List)PhysicsISBN:9781337399944Author:Michael A. SeedsPublisher:Cengage Learning
![Text book image](https://www.bartleby.com/isbn_cover_images/9781938168284/9781938168284_smallCoverImage.gif)
![Text book image](https://www.bartleby.com/isbn_cover_images/9781305804562/9781305804562_smallCoverImage.jpg)
![Text book image](https://www.bartleby.com/isbn_cover_images/9781305120785/9781305120785_smallCoverImage.gif)
![Text book image](https://www.bartleby.com/isbn_cover_images/9780078807213/9780078807213_smallCoverImage.gif)
![Text book image](https://www.bartleby.com/isbn_cover_images/9781337399920/9781337399920_smallCoverImage.gif)
![Text book image](https://www.bartleby.com/isbn_cover_images/9781337399944/9781337399944_smallCoverImage.gif)