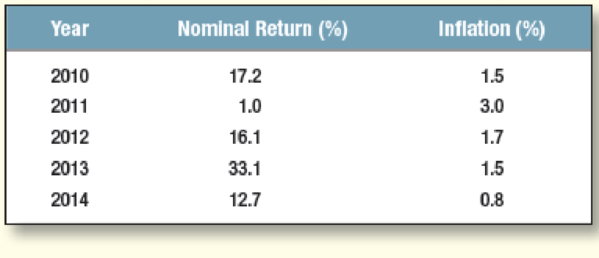
Standard deviation of returns The following table shows the nominal returns on the U.S. stocks and the rate of inflation.
- a. What was the standard deviation of the nominal market returns?
- b. Calculate the arithmatic average real return.

a.
To compute: The standard deviation of nominal market return.
Explanation of Solution
The formula to calculate average nominal return is as follows:
The computation of average nominal return is as follows:
Hence, the average nominal return is 16.02%.
The formula to calculate variance is as follows:
The calculation of variance is as follows:
Hence, the variance is .010595
The formula to calculate standard deviation is as follows:
The Computation of standard deviation is as follows:
Hence, the standard deviation of nominal market return is 10.29%%.
b.
To compute: The arithmetic average real return.
Explanation of Solution
The formula to calculate average real return is as follows:
The computation of average real return is as follows:
Hence, the average real return is .1412, or 14.12%.
Want to see more full solutions like this?
Chapter 7 Solutions
Principles of Corporate Finance (Mcgraw-hill/Irwin Series in Finance, Insurance, and Real Estate)
- Don't used hand raiting and don't used Ai solutionarrow_forwardDon't used Ai solution and don't used hand raitingarrow_forward(d) Estimate the value of a share of Cisco common stock using the discounted cash flow (DCF) model as of July 27, 2019 using the following assumptions Assumptions Discount rate (WACC) Common shares outstanding 7.60% 5,029.00 million Net nonoperating obligations (NNO) $(8,747) million NNO is negative, which means that Cisco has net nonoperating investments CSCO ($ millions) DCF Model Reported 2019 Forecast Horizon 2020 Est. 2021 Est. 2022 Est. 2023 Est. Terminal Period Increase in NOA FCFF (NOPAT - Increase in NOA) $ 1241 1303 1368 10673 11207 11767 1437 $ 12354 302 ✓ Present value of horizon FCFF 9918 9679 9445 ✔ 0 × Cum. present value of horizon FCFF $ 0 × Present value of terminal FCFF 0 ☑ Total firm value 0 ☑ NNO -8747 ✓ Firm equity value $ 0 ☑ Shares outstanding (millions) 5029 Stock price per share $ 40.05arrow_forward
- Q1: Blossom is 30 years old. She plans on retiring in 25 years, at the age of 55. She believes she will live until she is 105. In order to live comfortably, she needs a substantial retirement income. She wants to receive a weekly income of $5,000 during retirement. The payments will be made at the beginning of each week during her retirement. Also, Blossom has pledged to make an annual donation to her favorite charity during her retirement. The payments will be made at the end of each year. There will be a total of 50 annual payments to the charity. The first annual payment will be for $20,000. Blossom wants the annual payments to increase by 3% per year. The payments will end when she dies. In addition, she would like to establish a scholarship at Toronto Metropolitan University. The first payment would be $80,000 and would be made 3 years after she retires. Thereafter, the scholarship payments will be made every year. She wants the payments to continue after her death,…arrow_forwardCould you please help explain what is the research assumptions, research limitations, research delimitations and their intent? How the research assumptions, research limitations can shape the study design and scope? How the research delimitations could help focus the study and ensure its feasibility? What are the relationship between biblical principles and research concepts such as reliability and validity?arrow_forwardWhat is the concept of the working poor ? Introduction form. Explain.arrow_forward
- What is the most misunderstanding of the working poor? Explain.arrow_forwardProblem Three (15 marks) You are an analyst in charge of valuing common stocks. You have been asked to value two stocks. The first stock NEWER Inc. just paid a dividend of $6.00. The dividend is expected to increase by 60%, 45%, 30% and 15% per year, respectively, in the next four years. Thereafter, the dividend will increase by 4% per year in perpetuity. Calculate NEWER’s expected dividend for t = 1, 2, 3, 4 and 5. The required rate of return for NEWER stock is 14% compounded annually. What is NEWER’s stock price? The second stock is OLDER Inc. OLDER Inc. will pay its first dividend of $10.00 three (3) years from today. The dividend will increase by 30% per year for the following four (4) years after its first dividend payment. Thereafter, the dividend will increase by 3% per year in perpetuity. Calculate OLDER’s expected dividend for t = 1, 2, 3, 4, 5, 6, 7 and 8. The required rate of return for OLDER stock is 16% compounded annually. What is OLDER’s stock price? Now assume that…arrow_forwardProblem Three (15 marks) You are an analyst in charge of valuing common stocks. You have been asked to value two stocks. The first stock NEWER Inc. just paid a dividend of $6.00. The dividend is expected to increase by 60%, 45%, 30% and 15% per year, respectively, in the next four years. Thereafter, the dividend will increase by 4% per year in perpetuity. Calculate NEWER’s expected dividend for t = 1, 2, 3, 4 and 5. The required rate of return for NEWER stock is 14% compounded annually. What is NEWER’s stock price? The second stock is OLDER Inc. OLDER Inc. will pay its first dividend of $10.00 three (3) years from today. The dividend will increase by 30% per year for the following four (4) years after its first dividend payment. Thereafter, the dividend will increase by 3% per year in perpetuity. Calculate OLDER’s expected dividend for t = 1, 2, 3, 4, 5, 6, 7 and 8. The required rate of return for OLDER stock is 16% compounded annually. What is OLDER’s stock price? Now assume that…arrow_forward
