
Concept explainers
Videos
EXERCISES
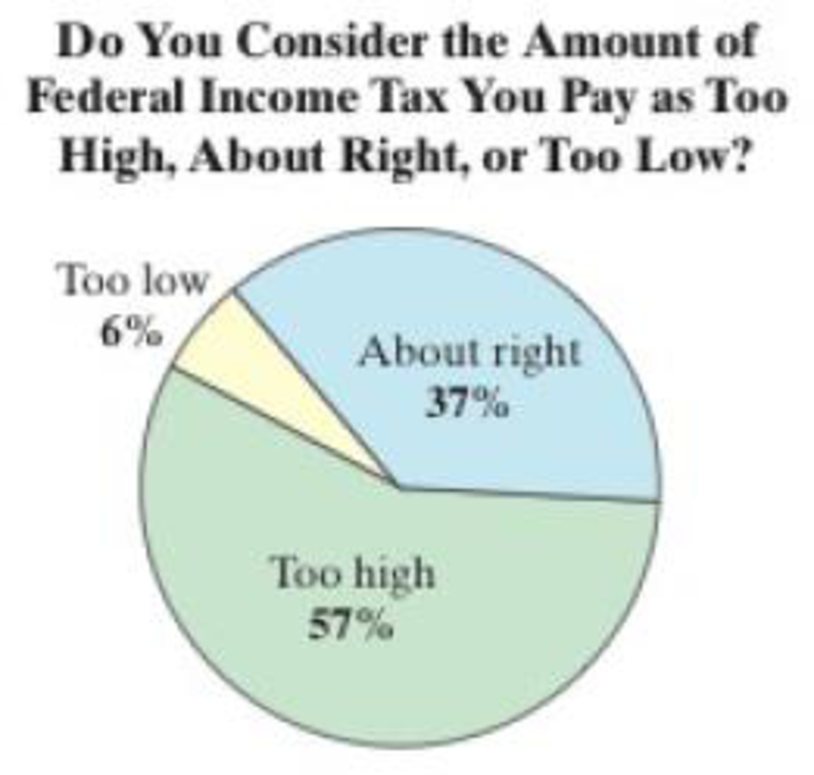
In Exercises 1–3, assume that you work for the Internal Revenue Service. You are asked to write a report about the claim that 57% of U.S. adults think the amount of federal income tax they pay is too high. (Source: Gallup)
- 1. What is the null hypothesis in this situation? Describe how your report could be incorrect by trying to prove the null hypothesis.
- 2. Describe how your report could make a type I error.
- 3. Describe how your report could make a type II error.
To state: The null hypothesis in the given situation and describe how the report could be incorrect by trying to prove the null hypothesis.
Answer to Problem 1UA
The null hypothesis in the given situation is,
When type error is present, the report could be incorrect by trying to prove the null hypothesis.
Explanation of Solution
Null hypothesis:
Null hypothesis is a statement about the population parameter. Its value is equal to the claim value, which is denoted by
Alternative hypothesis:
It is complementary to the null hypothesis. That is, it differs from the null hypothesis. The possible symbols used in the alternative hypothesis would be <,>, or ≠. It is denoted by
Here, the claim is that, “57% of U.S adults think the amount of federal income tax they pay is too high”. This can be written as
Null hypothesis:
Type I error: Rejecting the null hypothesis, when it is actually true.
Type II error: Failing to reject the null hypothesis, when it is false.
A type I error occurs when the hypothesis test indicates that the percentage of U.S. adults think the amount of federal income tax they pay is too high is not 57%; but in reality, the percentage of U.S. adults think the amount of federal income tax they pay is too high is 57%. Thus, the report could be incorrect by trying to prove the null hypothesis when the type error I is present.
Want to see more full solutions like this?
Chapter 7 Solutions
Elementary Statistics: Picturing the World (7th Edition)


- Examine the Variables: Carefully review and note the names of all variables in the dataset. Examples of these variables include: Mileage (mpg) Number of Cylinders (cyl) Displacement (disp) Horsepower (hp) Research: Google to understand these variables. Statistical Analysis: Select mpg variable, and perform the following statistical tests. Once you are done with these tests using mpg variable, repeat the same with hp Mean Median First Quartile (Q1) Second Quartile (Q2) Third Quartile (Q3) Fourth Quartile (Q4) 10th Percentile 70th Percentile Skewness Kurtosis Document Your Results: In RStudio: Before running each statistical test, provide a heading in the format shown at the bottom. “# Mean of mileage – Your name’s command” In Microsoft Word: Once you've completed all tests, take a screenshot of your results in RStudio and paste it into a Microsoft Word document. Make sure that snapshots are very clear. You will need multiple snapshots. Also transfer these results to the…arrow_forward2 (VaR and ES) Suppose X1 are independent. Prove that ~ Unif[-0.5, 0.5] and X2 VaRa (X1X2) < VaRa(X1) + VaRa (X2). ~ Unif[-0.5, 0.5]arrow_forward8 (Correlation and Diversification) Assume we have two stocks, A and B, show that a particular combination of the two stocks produce a risk-free portfolio when the correlation between the return of A and B is -1.arrow_forward
- 9 (Portfolio allocation) Suppose R₁ and R2 are returns of 2 assets and with expected return and variance respectively r₁ and 72 and variance-covariance σ2, 0%½ and σ12. Find −∞ ≤ w ≤ ∞ such that the portfolio wR₁ + (1 - w) R₂ has the smallest risk.arrow_forward7 (Multivariate random variable) Suppose X, €1, €2, €3 are IID N(0, 1) and Y2 Y₁ = 0.2 0.8X + €1, Y₂ = 0.3 +0.7X+ €2, Y3 = 0.2 + 0.9X + €3. = (In models like this, X is called the common factors of Y₁, Y₂, Y3.) Y = (Y1, Y2, Y3). (a) Find E(Y) and cov(Y). (b) What can you observe from cov(Y). Writearrow_forward1 (VaR and ES) Suppose X ~ f(x) with 1+x, if 0> x > −1 f(x) = 1−x if 1 x > 0 Find VaRo.05 (X) and ES0.05 (X).arrow_forward
- Joy is making Christmas gifts. She has 6 1/12 feet of yarn and will need 4 1/4 to complete our project. How much yarn will she have left over compute this solution in two different ways arrow_forwardSolve for X. Explain each step. 2^2x • 2^-4=8arrow_forwardOne hundred people were surveyed, and one question pertained to their educational background. The results of this question and their genders are given in the following table. Female (F) Male (F′) Total College degree (D) 30 20 50 No college degree (D′) 30 20 50 Total 60 40 100 If a person is selected at random from those surveyed, find the probability of each of the following events.1. The person is female or has a college degree. Answer: equation editor Equation Editor 2. The person is male or does not have a college degree. Answer: equation editor Equation Editor 3. The person is female or does not have a college degree.arrow_forward
 Holt Mcdougal Larson Pre-algebra: Student Edition...AlgebraISBN:9780547587776Author:HOLT MCDOUGALPublisher:HOLT MCDOUGAL
 College Algebra (MindTap Course List)AlgebraISBN:9781305652231Author:R. David Gustafson, Jeff HughesPublisher:Cengage Learning
 Glencoe Algebra 1, Student Edition, 9780079039897...AlgebraISBN:9780079039897Author:CarterPublisher:McGraw Hill