
Concept explainers
Videos
Answers to all problems are at the end of this book. Detailed solutions are available in the Student Solutions Manual, Study Guide, and Problems Book.
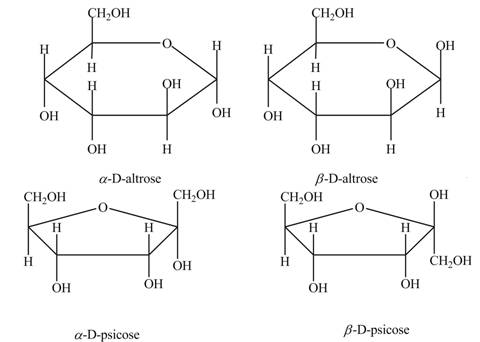
Drawing Haworth Structures of Sugars Draw Haworth structures for the two possible isomers of D-altrose (Figure 7.2) and D-psicose (Figure 7.3).
Interpretation: The Haworth structures for two possible isomers of
Concept introduction: The simplest hydrolyzed form that is obtained from the carbohydrates is known as a monosaccharide.
Haworth projection is a method that is used to provide the three-dimensional cyclic form of a monosaccharide. This method shows the monosaccharide in the form of a hemiacetal ring or hemiketal ring.
Carbon atom which behaves as a stereocenter or a chiral center in the cyclic ring form of the hemiacetal or hemiketal compound is known as anomeric carbon.
Answer to Problem 1P
The Haworth structures for two possible isomers of
Explanation of Solution
The anomeric carbon of a monosaccharide unit always possesses two types of isomers. One is
The molecular formula of
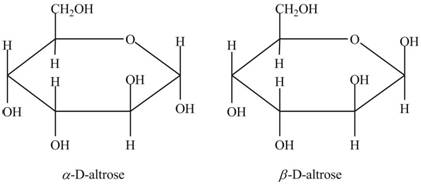
Figure 1
In the Haworth projection of
The molecular formula of
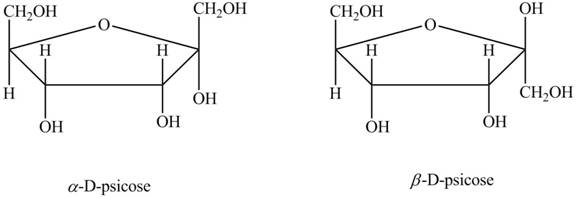
Figure 2
In the Haworth projection of
Want to see more full solutions like this?
Chapter 7 Solutions
Biochemistry


- The following data were recorded for the enzyme catalyzed conversion of S -> P. Question: Estimate the Vmax and Km. What would be the rate at 2.5 and 5.0 x 10⁻⁵ M [S] ?arrow_forwardPlease helparrow_forwardThe following data were recorded for the enzyme catalyzed conversion of S -> P Question: what would the rate be at 5.0 x 10⁻⁵ M [S] and the enzyme concentration was doubled? Also, the rate given in the table is from product accumulation after 10 minuets of reaction time. Verify these rates represent a true initial rate (less than 5% turnover). Please helparrow_forward
- The following data was obtained on isocitrate lyase from an algal species. Identify the reaction catalyzed by this enzyme, deduce the KM and Vmax , and determine the nature of the inhibition by oxaloacetate. Please helparrow_forwardIn the table below, there are sketches of four crystals made of positively-charged cations and negatively-charged anions. Rank these crystals in decreasing order of stability (or equivalently increasing order of energy). That is, select "1" below the most stable (lowest energy) crystal. Select "2" below the next most stable (next lowest energy) crystal, and so forth. A B 鹽 (Choose one) +2 C +2 +2 (Choose one) D 鹽雞 (Choose one) (Choose one)arrow_forward1. Draw the structures for the fats A. 16:2: w-3 and B. 18:3:49,12,15 2. Name each of the molecules below (image attached)arrow_forward
- draw the structures for the fats A. 16:2:w-3 B 18:3:9,12,15arrow_forward1. Below is a template strand of DNA. Show the mRNA and protein that would result. label the ends of the molecules ( refer to attached image)arrow_forwardAttach the followina labels to the diagram below: helicase, single stranded binding proteins, lagging strand, leading strand, DNA polymerase, primase, 5' ends (3), 3' ends (3) (image attached)arrow_forward
- 1. How much energy in terms of ATP can be obtained from tristearin (stearate is 18:0) Show steps pleasearrow_forwardMultiple choice urgent!!arrow_forward1. Write the transamination reaction for alanine. Indicate what happens next to each of the molecules in the reaction, and under what conditions it happens. 2.arrow_forward
 BiochemistryBiochemistryISBN:9781305577206Author:Reginald H. Garrett, Charles M. GrishamPublisher:Cengage Learning