
Videos
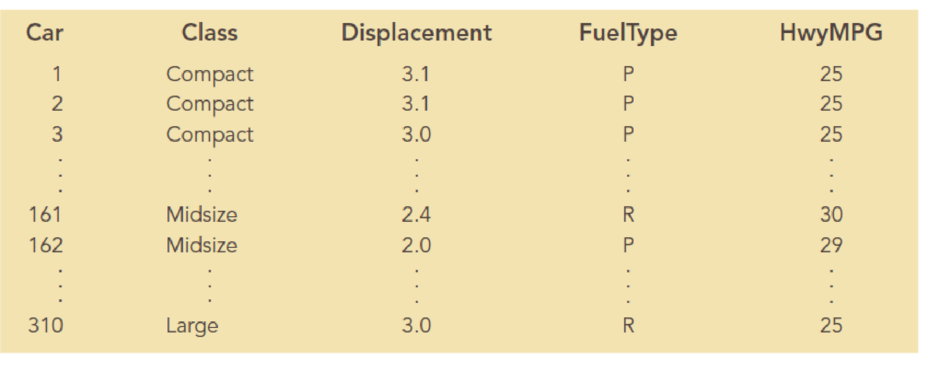
The U.S. Department of Energy’s Fuel Economy Guide provides fuel efficiency data for cars and trucks. A portion of the data for 311 compact, midsized, and large cars follows. The Class column identifies the size of the car: Compact, Midsize, or Large. The Displacement column shows the engine’s displacement in liters. The FuelType column shows whether the car uses premium (P) or regular (R) fuel, and the HwyMPG column shows the fuel efficiency rating for highway driving in terms of miles per gallon. The complete data set is contained in the tile FuelData:
- a. Develop an estimated regression equation that can be used to predict the fuel efficiency for highway driving given the engine’s displacement. Test for significance using the 0.05 level of significance. How much of the variation in the sample values of HwyMPG does this estimated regression equation explain?
- b. Create a scatter chart with HwyMPG on the y-axis and displacement on the x-axis for which the points representing compact, midsize, and large automobiles are shown in different shapes and/or colors. What does this chart suggest about the relationship between the class of automobile (compact, midsize, and large) and HwyMPG?
- c. Now consider the addition of the dummy variables ClassMidsize and ClassLarge to the simple linear regression model in part (a). The value of ClassMidsize is 1 if the car is a midsize car and 0 otherwise; the value of ClassLarge is 1 if the car is a large car and 0 otherwise. Thus, for a compact car, the value of ClassMidsize and the value of ClassLarge are both 0. Develop the estimated regression equation that can be used to predict the fuel efficiency for highway driving, given the engine’s displacement and the dummy variables ClassMidsize and ClassLarge. How much of the variation in the sample values of HwyMPG is explained by this estimated regression equation?
- d. Use significance level of 0.05 to determine whether the dummy variables added to the model in part (c) are significant.
- e. Consider the addition of the dummy variable FuelPremium, where the value of FuelPremium is 1 if the car uses premium fuel and 0 if the car uses regular fuel. Develop the estimated regression equation that can be used to predict the fuel efficiency for highway driving given the engine’s displacement, the dummy variables ClassMidsize and ClassLarge, and the dummy variable FuelPremium. How much of the variation in the sample values of HwyMPG does this estimated regression equation explain?
- f. For the estimated regression equation developed in part (e), test for the significance of the relationship between each of the independent variables and the dependent variable using the 0.05 level of significance for each test.

Trending nowThis is a popular solution!

Chapter 7 Solutions
Mindtap Business Analytics, 1 Term (6 Months) Printed Access Card For Camm/cochran/fry/ohlmann/anderson/sweeney/williams' Essentials Of Business Analytics, 2nd


- I need help with this problem and an explanation of the solution for the image described below. (Statistics: Engineering Probabilities)arrow_forward310015 K Question 9, 5.2.28-T Part 1 of 4 HW Score: 85.96%, 49 of 57 points Points: 1 Save of 6 Based on a poll, among adults who regret getting tattoos, 28% say that they were too young when they got their tattoos. Assume that six adults who regret getting tattoos are randomly selected, and find the indicated probability. Complete parts (a) through (d) below. a. Find the probability that none of the selected adults say that they were too young to get tattoos. 0.0520 (Round to four decimal places as needed.) Clear all Final check Feb 7 12:47 US Oarrow_forwardhow could the bar graph have been organized differently to make it easier to compare opinion changes within political partiesarrow_forward
- 30. An individual who has automobile insurance from a certain company is randomly selected. Let Y be the num- ber of moving violations for which the individual was cited during the last 3 years. The pmf of Y isy | 1 2 4 8 16p(y) | .05 .10 .35 .40 .10 a.Compute E(Y).b. Suppose an individual with Y violations incurs a surcharge of $100Y^2. Calculate the expected amount of the surcharge.arrow_forward24. An insurance company offers its policyholders a num- ber of different premium payment options. For a ran- domly selected policyholder, let X = the number of months between successive payments. The cdf of X is as follows: F(x)=0.00 : x < 10.30 : 1≤x<30.40 : 3≤ x < 40.45 : 4≤ x <60.60 : 6≤ x < 121.00 : 12≤ x a. What is the pmf of X?b. Using just the cdf, compute P(3≤ X ≤6) and P(4≤ X).arrow_forward59. At a certain gas station, 40% of the customers use regular gas (A1), 35% use plus gas (A2), and 25% use premium (A3). Of those customers using regular gas, only 30% fill their tanks (event B). Of those customers using plus, 60% fill their tanks, whereas of those using premium, 50% fill their tanks.a. What is the probability that the next customer will request plus gas and fill the tank (A2 B)?b. What is the probability that the next customer fills the tank?c. If the next customer fills the tank, what is the probability that regular gas is requested? Plus? Premium?arrow_forward
- 38. Possible values of X, the number of components in a system submitted for repair that must be replaced, are 1, 2, 3, and 4 with corresponding probabilities .15, .35, .35, and .15, respectively. a. Calculate E(X) and then E(5 - X).b. Would the repair facility be better off charging a flat fee of $75 or else the amount $[150/(5 - X)]? [Note: It is not generally true that E(c/Y) = c/E(Y).]arrow_forward74. The proportions of blood phenotypes in the U.S. popula- tion are as follows:A B AB O .40 .11 .04 .45 Assuming that the phenotypes of two randomly selected individuals are independent of one another, what is the probability that both phenotypes are O? What is the probability that the phenotypes of two randomly selected individuals match?arrow_forward53. A certain shop repairs both audio and video compo- nents. Let A denote the event that the next component brought in for repair is an audio component, and let B be the event that the next component is a compact disc player (so the event B is contained in A). Suppose that P(A) = .6 and P(B) = .05. What is P(BA)?arrow_forward
 Algebra: Structure And Method, Book 1AlgebraISBN:9780395977224Author:Richard G. Brown, Mary P. Dolciani, Robert H. Sorgenfrey, William L. ColePublisher:McDougal Littell
 Glencoe Algebra 1, Student Edition, 9780079039897...AlgebraISBN:9780079039897Author:CarterPublisher:McGraw Hill
 Holt Mcdougal Larson Pre-algebra: Student Edition...AlgebraISBN:9780547587776Author:HOLT MCDOUGALPublisher:HOLT MCDOUGAL
 Mathematics For Machine TechnologyAdvanced MathISBN:9781337798310Author:Peterson, John.Publisher:Cengage Learning,