
Concept explainers
Videos
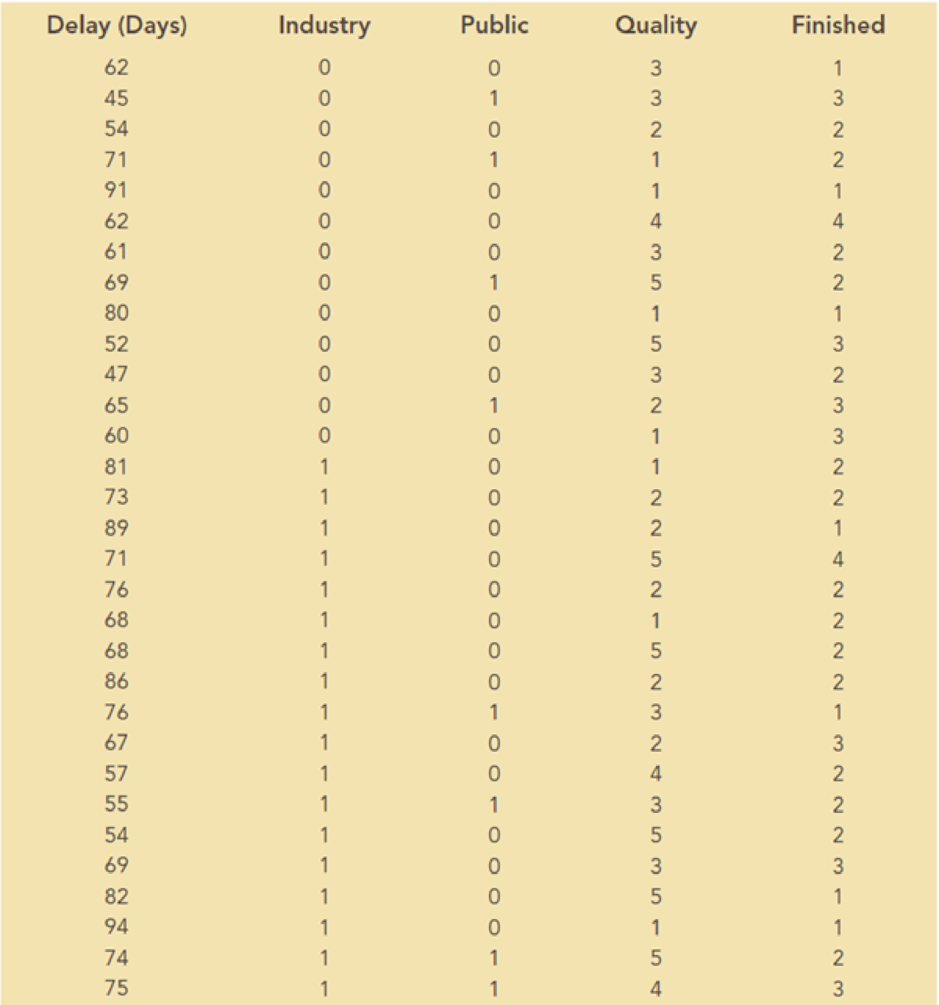
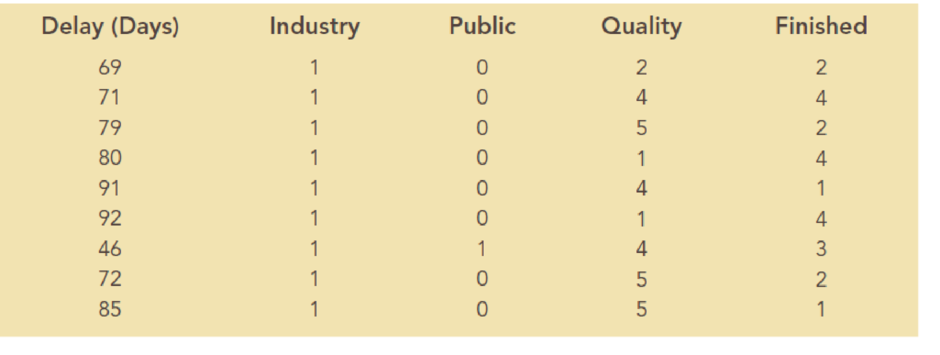
A study investigated the relationship between audit delay (the length of time from a company’s fiscal year-end to the date of the auditor’s report) and variables that describe the client and the auditor. Some of the independent variables that were included in this study follow:
Industry A dummy variable coded 1 if the firm was an industrial company or 0 if the firm was a bank, savings and loan, or insurance company.
Public A dummy variable coded 1 if the company was traded on an organized exchange or over the counter: otherwise coded 0.
Quality A measure of overall quality of internal controls, as judged by the auditor, on a 5-point scale
Finished A measure ranging from 1 to 4, as judged by the auditor, where 1 indicates “all work performed subsequent to year-end” and 4 indicates “most work performed prior to year-end.”
A sample of 40 companies provided the following data:
- a. Develop the estimated regression equation using all of the independent variables included in the data.
- b. How much of the variation in the sample values of delay does this estimated regression equation explain? What other independent variables could you include in this regression model to improve the fit?
- c. Test the relationship between each independent variable and the dependent variable at the 0.05 level of significance, and interpret the relationship between each of the independent variables and the dependent variable.
- d. On the basis of your observations about the relationships between the dependent variable Delay and the independent variables Quality and Finished, suggest an alternative model for the regression equation developed in part (a) to explain as much of the variability in Delay as possible.

Trending nowThis is a popular solution!

Chapter 7 Solutions
Mindtap Business Analytics, 1 Term (6 Months) Printed Access Card For Camm/cochran/fry/ohlmann/anderson/sweeney/williams' Essentials Of Business Analytics, 2nd


- uppose automobile insurance companies gave annual premiums for top-rated companies in several states. The figure below shows box plots for the annual premium for urban customers in three states. Which state offers the lowest premium? Which state offers the highest premium?arrow_forwardWing Foot is a shoe franchise commonly found in shopping centers across the United States. Wing Foot knows that its stores will not show a profit unless they gross over $940,000 per year. Let A be the event that a new Wing Foot store grosses over $940,000 its first year. Let B be the event that a store grosses over $940,000 its second year. Wing Foot has an administrative policy of closing a new store if it does not show a profit in either of the first two years. Assume that the accounting office at Wing Foot provided the following information: 58% of all Wing Foot stores show a profit the first year; 72% of all Wing Foot store show a profit the second year (this includes stores that did not show a profit the first year); however, 86% of Wing Foot stores that showed a profit the first year also showed a profit the second year. Compute P(B|Ac). Round your answer to the nearest hundredth.arrow_forwardYou draw two cards from a standard deck of 52 cards, but before you draw the second card, you put the first one back and reshuffle the deck. If you get a3on the first card, find the probability of drawing a 3 for the second card.arrow_forward
- Do bonds reduce the overall risk of an investment portfolio? Let x be a random variable representing annual percent return for the Vanguard Total Stock Index (all Stocks). Let y be a random variable representing annual return for the Vanguard Balanced Index (60% stock and 40% bond). For the past several years, assume the following data. Compute the coefficient of variation for each fund. Round your answers to the nearest tenth. x: 14 0 37 21 35 23 24 -14 -14 -17 y: 8 -2 29 17 22 17 17 -2 -3 -8arrow_forwardWhat percentage of the general U.S. population have bachelor's degrees? Suppose that the Statistical Abstract of the United States, 120th Edition, gives the following percentage of bachelor’s degrees by state. For convenience, the data are sorted in increasing order. 17 18 18 18 19 20 20 20 21 21 21 21 21 22 22 22 22 22 23 23 24 24 24 24 24 25 25 25 25 26 26 26 26 26 26 27 27 27 28 28 28 29 29 31 31 32 32 34 35 38 Illinois has a bachelor's degree percentage rate of about 18%. Into what quartile does this rate fall?arrow_forwardWhat percentage of the general U.S. population have bachelor's degrees? Suppose that the Statistical Abstract of the United States, 120th Edition, gives the following percentage of bachelor’s degrees by state. For convenience, the data are sorted in increasing order. 17 18 18 18 19 20 20 20 21 21 21 21 21 22 22 22 22 22 23 23 24 24 24 24 24 25 25 25 25 26 26 26 26 26 26 27 27 27 28 28 28 29 29 31 31 32 32 34 35 38 Illinois has a bachelor's degree percentage rate of about 18%. Into what quartile does this rate fall?arrow_forward
- Find the range for the following sample data. x 23 17 11 30 27arrow_forwardDo bonds reduce the overall risk of an investment portfolio? Let x be a random variable representing annual percent return for the Vanguard Total Stock Index (all Stocks). Let y be a random variable representing annual return for the Vanguard Balanced Index (60% stock and 40% bond). For the past several years, assume the following data. Compute the sample mean for x and for y. Round your answer to the nearest tenth. x: 11 0 36 22 34 24 25 -11 -11 -22 y: 9 -3 28 14 23 16 14 -3 -4 -9arrow_forwardDo bonds reduce the overall risk of an investment portfolio? Let x be a random variable representing annual percent return for the Vanguard Total Stock Index (all Stocks). Let y be a random variable representing annual return for the Vanguard Balanced Index (60% stock and 40% bond). For the past several years, assume the following data. Compute the range for variable y. X 12 0 36 21 35 23 24 -12 -12 -21 Y 10 -2 26 15 22 18 15 -2 -3 -10arrow_forward
- Do bonds reduce the overall risk of an investment portfolio? Let x be a random variable representing annual percent return for the Vanguard Total Stock Index (all Stocks). Let y be a random variable representing annual return for the Vanguard Balanced Index (60% stock and 40% bond). For the past several years, assume the following data. Compute the range for variable y. X 12 0 36 21 35 23 24 -12 -12 -21 Y 10 -2 26 15 22 18 15 -2 -3 -10arrow_forwardDo bonds reduce the overall risk of an investment portfolio? Let x be a random variable representing annual percent return for the Vanguard Total Stock Index (all Stocks). Let y be a random variable representing annual return for the Vanguard Balanced Index (60% stock and 40% bond). For the past several years, assume the following data. Compute the range for variable x. X 15 0 37 23 33 25 26 -15 -15 -23 Y 6 -1 28 18 24 17 18 -1 -2 -6arrow_forward7.16. If the probability density of X is given by g kx³ for x>0 f(x) = (1+2x)6 0 10-01, elsewhere trolls inf ( 2X density of the random variable Y = where k is an appropriate constant, find the probability 1+2X distribution of Y, and thus determine the value of k. 7 Identify thearrow_forward
 Big Ideas Math A Bridge To Success Algebra 1: Stu...AlgebraISBN:9781680331141Author:HOUGHTON MIFFLIN HARCOURTPublisher:Houghton Mifflin Harcourt
 Glencoe Algebra 1, Student Edition, 9780079039897...AlgebraISBN:9780079039897Author:CarterPublisher:McGraw Hill