
Videos
The article “Time Series Analysis for Construction Productivity Experiments” (T. Abdelhamid and J. Everett. Journal of Construction Engineering and Management. 1999:87–95) presents a study comparing the effectiveness of a video system that allows a crane operator to see the lifting point while operating the crane with the old system in which the operator relies on hand signals from a tagman. Three different lifts, A, B, and C, were studied. Lift A was of little difficulty, lift B was of moderate difficulty, and lift C was of high difficulty. Each lift was performed several times, both with the new video system and with the old tagman system. The time (in seconds) required to perform each lift was recorded. The following tables present the means, standard deviations, and
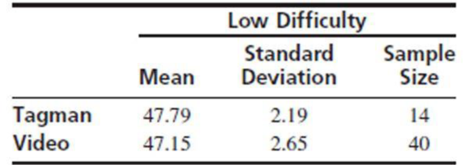
- a. Can you conclude that the mean time to perform a lift of low difficulty is less when using the video system than when using the tagman system? Explain.
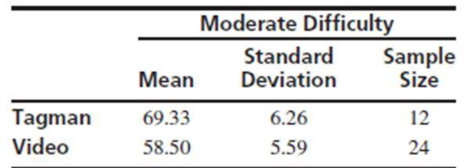
- b. Can you conclude that the mean time to perform a lift of moderate difficulty is less when using the video system than when using the tagman system? Explain.
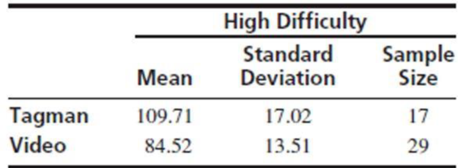
- c. Can you conclude that the mean time to perform a lift of high difficulty is less when using the video system than when using the tagman system? Explain.
a.
Check whether there is evidence to conclude that the mean time to perform a lift of low difficulty is less when using the video system than when using the tagman system.
Answer to Problem 4E
There is no evidence to conclude that the mean time to perform a lift of low difficulty is less when using the video system than when using the tagman system.
Explanation of Solution
Given info:
Three different lifts, A, B, and C, were studied in the given experiment. Lift A was of little difficulty, lift B was of moderate difficulty, and lift C was of high difficulty. The summary statistics for three lifts are given below:
Low difficulty:
Tagman:
Video:
Moderate difficulty:
Tagman:
Video:
High difficulty:
Tagman:
Video:
Calculation:
State the test hypotheses.
Null hypothesis:
Alternative hypothesis:
Tests statistic and P-value:
Software Procedure:
Step-by-step procedure to obtain the test statistic using the MINITAB software:
- Choose Stat > Basic Statistics > 2-Sample t.
- Choose Summarized data.
- In first, enter Sample size as 14, Mean as 47.79, Standard deviation as 2.19.
- In second, enter Sample size as 40, Mean as 47.15, Standard deviation as 2.65.
- Choose Options.
- In Confidence level, enter 95.
- In Alternative, select greater than.
- Click OK in all the dialogue boxes.
Output using the MINITAB software is given below:
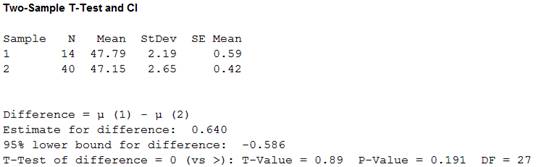
From the MINITAB output, the test statistic is 0.89 and the P-value is 0.191.
Conclusion:
The P-value is 0.191 and the significance level is 0.05.
Here, the P-value is greater than the significance level.
That is,
Therefore, the null hypothesis is not rejected.
Thus, there is no evidence to conclude that the mean time to perform a lift of low difficulty is less when using the video system than when using the tagman system.
b.
Check whether there is evidence to conclude that the mean time to perform a lift of moderate difficulty is less when using the video system than when using the tagman system.
Answer to Problem 4E
There is evidence to conclude that the mean time to perform a lift of moderate difficulty is less when using the video system than when using the tagman system.
Explanation of Solution
Calculation:
State the test hypotheses.
Null hypothesis:
Alternative hypothesis:
Tests statistic and P-value:
Software Procedure:
Step-by-step procedure to obtain the test statistic using the MINITAB software:
- Choose Stat > Basic Statistics > 2-Sample t.
- Choose Summarized data.
- In first, enter Sample size as 12, Mean as 69.33, Standard deviation as 6.26.
- In second, enter Sample size as 24, Mean as 58.50, Standard deviation as 5.59.
- Choose Options.
- In Confidence level, enter 95.
- In Alternative, select greater than.
- Click OK in all the dialogue boxes.
Output using the MINITAB software is given below:
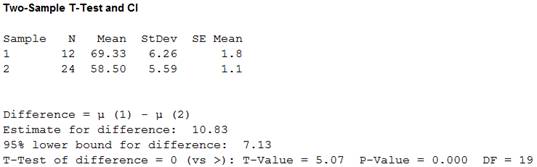
From the MINITAB output, the test statistic is 5.07 and the P-value is 0.000.
Conclusion:
The P-value is 0.000 and the significance level is 0.05.
Here, the P-value is less than the significance level.
That is,
Therefore, the null hypothesis is rejected.
Thus, there is evidence to conclude that the mean time to perform a lift of moderate difficulty is less when using the video system than when using the tagman system.
c.
Check whether there is evidence to conclude that the mean time to perform a lift of high difficulty is less when using the video system than when using the tagman system.
Answer to Problem 4E
There is evidence to conclude that the mean time to perform a lift of high difficulty is less when using the video system than when using the tagman system.
Explanation of Solution
Calculation:
State the test hypotheses.
Null hypothesis:
Alternative hypothesis:
Tests statistic and P-value:
Software Procedure:
Step-by-step procedure to obtain the test statistic using the MINITAB software:
- Choose Stat > Basic Statistics > 2-Sample t.
- Choose Summarized data.
- In first, enter Sample size as 17, Mean as 109.71, Standard deviation as 17.02.
- In second, enter Sample size as 29, Mean as 84.52, Standard deviation as 13.51.
- Choose Options.
- In Confidence level, enter 95.
- In Alternative, select greater than.
- Click OK in all the dialogue boxes.
Output using the MINITAB software is given below:
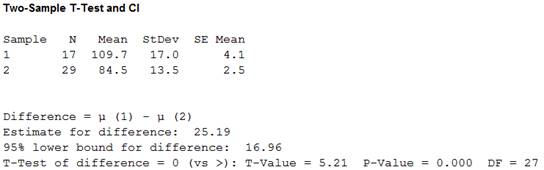
From the MINITAB output, the test statistic is 5.21 and the P-value is 0.000.
Conclusion:
The P-value is 0.000 and the significance level is 0.05.
Here, the P-value is less than the significance level.
That is,
Therefore, the null hypothesis is rejected.
Thus, there is evidence to conclude that the mean time to perform a lift of high difficulty is less when using the video system than when using the tagman system.
Want to see more full solutions like this?
Chapter 6 Solutions
EBK STATISTICS FOR ENGINEERS AND SCIENT
Additional Math Textbook Solutions
Thinking Mathematically (6th Edition)
Elementary Statistics: Picturing the World (7th Edition)
Elementary Statistics ( 3rd International Edition ) Isbn:9781260092561
Introductory Statistics
Calculus: Early Transcendentals (2nd Edition)
Mathematics for the Trades: A Guided Approach (11th Edition) (What's New in Trade Math)


- Let X be a continuous RV with PDF where a > 0 and 0 > 0 are parameters. verify that f-∞ /x (x)dx = 1. Find the CDF, Fx (7), of X.arrow_forward6. [20] Let X be a continuous RV with PDF 2(1), 1≤x≤2 fx(x) = 0, otherwisearrow_forwardA survey of 581 citizens found that 313 of them favor a new bill introduced by the city. We want to find a 95% confidence interval for the true proportion of the population who favor the bill. What is the lower limit of the interval? Enter the result as a decimal rounded to 3 decimal digits. Your Answer:arrow_forward
- A survey of 581 citizens found that 313 of them favor a new bill introduced by the city. We want to find a 95% confidence interval for the true proportion of the population who favor the bill. What is the lower limit of the interval? Enter the result as a decimal rounded to 3 decimal digits. Your Answer:arrow_forward2. The SMSA data consisting of 141 observations on 10 variables is fitted by the model below: 1 y = Bo+B1x4 + ẞ2x6 + ẞ3x8 + √1X4X8 + V2X6X8 + €. See Question 2, Tutorial 3 for the meaning of the variables in the above model. The following results are obtained: Estimate Std. Error t value Pr(>|t|) (Intercept) 1.302e+03 4.320e+02 3.015 0.00307 x4 x6 x8 x4:x8 x6:x8 -1.442e+02 2.056e+01 -7.013 1.02e-10 6.340e-01 6.099e+00 0.104 0.91737 -9.455e-02 5.802e-02 -1.630 0.10550 2.882e-02 2.589e-03 11.132 1.673e-03 7.215e-04 2.319 F) x4 1 3486722 3486722 17.9286 4.214e-05 x6 1 14595537 x8 x4:x8 x6:x8 1 132.4836 < 2.2e-16 1045693 194478 5.3769 0.02191 1 1198603043 1198603043 6163.1900 < 2.2e-16 1 25765100 25765100 1045693 Residuals 135 26254490 Estimated variance matrix (Intercept) x4 x6 x8 x4:x8 x6:x8 (Intercept) x4 x6 x8 x4:x8 x6:x8 0.18875694 1.866030e+05 -5.931735e+03 -2.322825e+03 -16.25142055 0.57188953 -5.931735e+03 4.228816e+02 3.160915e+01 0.61621781 -0.03608028 -0.00445013 -2.322825e+03…arrow_forwardIn some applications the distribution of a discrete RV, X resembles the Poisson distribution except that 0 is not a possible value of X. Consider such a RV with PMF where 1 > 0 is a parameter, and c is a constant. (a) Find the expression of c in terms of 1. (b) Find E(X). (Hint: You can use the fact that, if Y ~ Poisson(1), the E(Y) = 1.)arrow_forward
- Suppose that X ~Bin(n,p). Show that E[(1 - p)] = (1-p²)".arrow_forwardI need help with this problem and an explanation of the solution for the image described below. (Statistics: Engineering Probabilities)arrow_forwardI need help with this problem and an explanation of the solution for the image described below. (Statistics: Engineering Probabilities)arrow_forward
- This exercise is based on the following data on four bodybuilding supplements. (Figures shown correspond to a single serving.) Creatine(grams) L-Glutamine(grams) BCAAs(grams) Cost($) Xtend(SciVation) 0 2.5 7 1.00 Gainz(MP Hardcore) 2 3 6 1.10 Strongevity(Bill Phillips) 2.5 1 0 1.20 Muscle Physique(EAS) 2 2 0 1.00 Your personal trainer suggests that you supplement with at least 10 grams of creatine, 39 grams of L-glutamine, and 90 grams of BCAAs each week. You are thinking of combining Xtend and Gainz to provide you with the required nutrients. How many servings of each should you combine to obtain a week's supply that meets your trainer's specifications at the least cost? (If an answer does not exist, enter DNE.) servings of xtend servings of gainzarrow_forwardI need help with this problem and an explanation of the solution for the image described below. (Statistics: Engineering Probabilities)arrow_forwardI need help with this problem and an explanation of the solution for the image described below. (Statistics: Engineering Probabilities)arrow_forward
 Linear Algebra: A Modern IntroductionAlgebraISBN:9781285463247Author:David PoolePublisher:Cengage Learning
 Big Ideas Math A Bridge To Success Algebra 1: Stu...AlgebraISBN:9781680331141Author:HOUGHTON MIFFLIN HARCOURTPublisher:Houghton Mifflin Harcourt
 Functions and Change: A Modeling Approach to Coll...AlgebraISBN:9781337111348Author:Bruce Crauder, Benny Evans, Alan NoellPublisher:Cengage Learning