
Introduction To Statistics And Data Analysis
6th Edition
ISBN: 9781337794503
Author: PECK
Publisher: Cengage
expand_more
expand_more
format_list_bulleted
Concept explainers
Videos
Textbook Question
Chapter 6.4, Problem 41E
Using the probabilities calculated in the previous exercise, determine if the probabilities P(hybrid|male) and P(male|hybrid) equal. If not, write a sentence or two explaining the difference between these two probabilities.
6.40 The accompanying data are from the article “Characteristics of Buyers of Hybrid Honda Civic IMA: Preferences, Decision Process, Vehicle Ownership, and Willingness-to-Pay” (Institute for Environmental Decisions, November 2006). Each of 311 people who purchased a Honda Civic was classified according to sex and whether the car purchased had a hybrid engine or not.
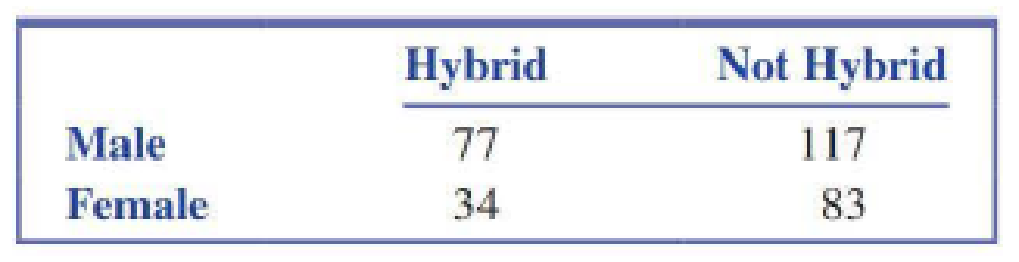
Suppose one of these 311 individuals is to be selected at random.
- a. Find the following probabilities:
- i. P(male)
- ii. P(hybrid)
- iii. P(hybrid|male)
- iv. P(hybrid|female)
- v. P(female|hybrid)
- b. For each of the probabilities calculated in Part (a), write a sentence interpreting the
probability . (Hint: See Example 6.13.)
Expert Solution & Answer

Trending nowThis is a popular solution!

Students have asked these similar questions
Test the claim that a student's pulse rate is different when taking a quiz than attending a regular class. The mean pulse rate difference is 2.7 with 10 students. Use a significance level of 0.005.
Pulse rate difference(Quiz - Lecture)
2
-1
5
-8
1
20
15
-4
9
-12
The following ordered data list shows the data speeds for cell phones used by a
telephone company at an airport:
A. Calculate the Measures of Central Tendency from the ungrouped data list.
B. Group the data in an appropriate frequency table.
C. Calculate the Measures of Central Tendency using the table in point B.
D. Are there differences in the measurements obtained in A and C? Why (give at
least one justified reason)?
I leave the answers to A and B to resolve the remaining two.
0.8
1.4
1.8
1.9
3.2
3.6
4.5
4.5
4.6
6.2
6.5
7.7
7.9
9.9
10.2
10.3
10.9
11.1
11.1
11.6
11.8
12.0
13.1
13.5
13.7
14.1
14.2
14.7
15.0
15.1
15.5
15.8
16.0
17.5
18.2
20.2
21.1
21.5
22.2
22.4
23.1
24.5
25.7
28.5
34.6
38.5
43.0
55.6
71.3
77.8
A. Measures of Central Tendency
We are to calculate:
Mean, Median, Mode
The data (already ordered) is:
0.8, 1.4, 1.8, 1.9, 3.2, 3.6, 4.5, 4.5, 4.6, 6.2, 6.5, 7.7, 7.9, 9.9, 10.2, 10.3, 10.9,
11.1, 11.1, 11.6,
11.8, 12.0, 13.1, 13.5, 13.7, 14.1, 14.2, 14.7, 15.0, 15.1, 15.5,…
PEER REPLY 1:
Choose a classmate's Main Post.
1. Indicate a range of values for the independent variable (x) that is reasonable
based on the data provided.
2. Explain what the predicted range of dependent values should be based on
the range of independent values.
Chapter 6 Solutions
Introduction To Statistics And Data Analysis
Ch. 6.1 - Define the term chance experiment, and give an...Ch. 6.1 - Define the term sample space, and then give the...Ch. 6.1 - Consider the chance experiment in which the type...Ch. 6.1 - Refer to the chance experiment described in the...Ch. 6.1 - A tennis shop sells five different brands of...Ch. 6.1 - Refer to the chance experiment described in the...Ch. 6.1 - A new model of laptop computer can be ordered with...Ch. 6.1 - A college library has four copies of a certain...Ch. 6.1 - A library has five copies of a certain textbook on...Ch. 6.1 - Suppose that, starting at a certain time,...
Ch. 6.1 - Refer to the previous exercise and now suppose...Ch. 6.1 - A family consisting of three peopleP1, P2, and...Ch. 6.1 - Prob. 13ECh. 6.1 - An engineering construction firm is currently...Ch. 6.1 - For the events described in the previous exercise,...Ch. 6.1 - Consider a Venn diagram picturing two events A and...Ch. 6.3 - A large department store offers online ordering....Ch. 6.3 - Consider the chance experiment described in the...Ch. 6.3 - The manager of an online music store has kept...Ch. 6.3 - Consider the chance experiment described in the...Ch. 6.3 - A bookstore sells two types of books (fiction and...Ch. 6.3 - Consider the chance experiment described in the...Ch. 6.3 - Medical insurance statuscovered (C) or not covered...Ch. 6.3 - Roulette is a game of chance that involves...Ch. 6.3 - Phoenix is a hub for a large airline. Suppose that...Ch. 6.3 - A customer satisfaction survey is planned. The...Ch. 6.3 - A professor assigns five problems to be completed...Ch. 6.3 - Refer to the following information on full-term...Ch. 6.3 - The report Teens, Social Media Technology...Ch. 6.3 - According to The Chronicle for Higher Education...Ch. 6.3 - The same issue of The Chronicle for Higher...Ch. 6.3 - A deck of 52 playing cards is mixed well, and 5...Ch. 6.3 - After all students have left the classroom, a...Ch. 6.3 - Use the information given in the previous exercise...Ch. 6.3 - The student council for a school of science and...Ch. 6.3 - A student placement center has requests from five...Ch. 6.3 - Suppose that a six-sided die is weighted so that...Ch. 6.4 - Two different airlines have a flight from Los...Ch. 6.4 - The article Chances Are You Know Someone with a...Ch. 6.4 - The accompanying data are from the article...Ch. 6.4 - Using the probabilities calculated in the previous...Ch. 6.4 - The following graphical display is similar to one...Ch. 6.4 - The article Americans Growing More Concerned About...Ch. 6.4 - The events E and T are defined as E = the event...Ch. 6.4 - The newspaper article Folic Acid Might Reduce Risk...Ch. 6.4 - Suppose that an individual is randomly selected...Ch. 6.4 - Is ultrasound a reliable method for determining...Ch. 6.4 - The paper Accuracy and Reliability of...Ch. 6.4 - The report 2015 Utah Seat Belt Use Survey (Utah...Ch. 6.4 - The National Highway Traffic Safety Administration...Ch. 6.4 - Use the information given in the previous exercise...Ch. 6.4 - The paper Good for Women, Good for Men, Bad for...Ch. 6.5 - Many fire stations handle emergency calls for...Ch. 6.5 - Refer to the information given in the previous...Ch. 6.5 - The paper Predictors of Complementary Therapy Use...Ch. 6.5 - The report TV Drama/Comedy Viewers and Health...Ch. 6.5 - The report Great Jobs, Great Lives. The...Ch. 6.5 - In a small city, approximately 15% of those...Ch. 6.5 - Jeanie is a bit forgetful, and if she doesnt make...Ch. 6.5 - Consider a system consisting of four components,...Ch. 6.5 - Consider the system described in the previous...Ch. 6.5 - In a January 2016 Harris Poll, each of 2252...Ch. 6.5 - Consider the following events: T = event that a...Ch. 6.5 - The following case study was reported in the...Ch. 6.5 - Three friends (A, B, and C) will participate in a...Ch. 6.5 - A store sells two different brands of dishwasher...Ch. 6.5 - The National Public Radio show Car Talk used to...Ch. 6.5 - Refer to the previous exercise. Suppose now that...Ch. 6.6 - A university has 10 vehicles available for use by...Ch. 6.6 - Prob. 70ECh. 6.6 - There are two traffic lights on Darlenes route...Ch. 6.6 - Let F denote the event that a randomly selected...Ch. 6.6 - According to a July 31, 2013 posting on cnn.com, a...Ch. 6.6 - Suppose that Blue Cab operates 15% of the taxis in...Ch. 6.6 - A large cable company reports the following: 80%...Ch. 6.6 - Refer to the information given in the previous...Ch. 6.6 - The authors of the paper Do Physicians Know When...Ch. 6.6 - A study of how people are using online services...Ch. 6.6 - The report Twitter in Higher Education: Usage...Ch. 6.6 - Use the information given in the previous exercise...Ch. 6.6 - Prob. 81ECh. 6.6 - Use the table of estimated probabilities from the...Ch. 6.6 - Suppose that we define the following events: C =...Ch. 6.6 - The article U.S. Investors Split Between Digital...Ch. 6.6 - Prob. 85ECh. 6.6 - The paper referenced in the previous exercise also...Ch. 6.6 - In an article that appears on the web site of the...Ch. 6.7 - The report Airline Quality Rating 2016...Ch. 6.7 - Five hundred first-year students at a state...Ch. 6.7 - Use the information given in the previous exercise...Ch. 6.7 - The table given below describes (approximately)...Ch. 6.7 - On April 1, 2010, the Bureau of the Census in the...Ch. 6.7 - Refer to the information given in the previous...Ch. 6.7 - Refer to the information given in Exercises 6.92...Ch. 6 - False positive results are not uncommon with...Ch. 6 - A company uses three different assembly linesA1,...Ch. 6 - Consider the following information about...Ch. 6 - Use the information given in the previous exercise...Ch. 6 - Use the information given in exercise 6.102 to...Ch. 6 - Prob. 105CRCh. 6 - The following table summarizing data on smoking...Ch. 6 - A study of the impact of seeking a second opinion...Ch. 6 - A company sends 40% of its overnight mail parcels...Ch. 6 - Prob. 109CRCh. 6 - Prob. 110CRCh. 6 - In a school machine shop, 60% of all machine...Ch. 6 - There are five faculty members in a certain...Ch. 6 - The general addition rule for three events states...Ch. 6 - A theater complex is currently showing four...Ch. 6 - Prob. 117CRCh. 6 - Suppose that a box contains 25 light bulbs, of...Ch. 6 - Return to Exercise 6.118, and suppose that 4 bulbs...Ch. 6 - A transmitter is sending a message using a binary...
Knowledge Booster


Learn more about
Need a deep-dive on the concept behind this application? Look no further. Learn more about this topic, statistics and related others by exploring similar questions and additional content below.Similar questions
- In a company with 80 employees, 60 earn $10.00 per hour and 20 earn $13.00 per hour. Is this average hourly wage considered representative?arrow_forwardThe following is a list of questions answered correctly on an exam. Calculate the Measures of Central Tendency from the ungrouped data list. NUMBER OF QUESTIONS ANSWERED CORRECTLY ON AN APTITUDE EXAM 112 72 69 97 107 73 92 76 86 73 126 128 118 127 124 82 104 132 134 83 92 108 96 100 92 115 76 91 102 81 95 141 81 80 106 84 119 113 98 75 68 98 115 106 95 100 85 94 106 119arrow_forwardThe following ordered data list shows the data speeds for cell phones used by a telephone company at an airport: A. Calculate the Measures of Central Tendency using the table in point B. B. Are there differences in the measurements obtained in A and C? Why (give at least one justified reason)? 0.8 1.4 1.8 1.9 3.2 3.6 4.5 4.5 4.6 6.2 6.5 7.7 7.9 9.9 10.2 10.3 10.9 11.1 11.1 11.6 11.8 12.0 13.1 13.5 13.7 14.1 14.2 14.7 15.0 15.1 15.5 15.8 16.0 17.5 18.2 20.2 21.1 21.5 22.2 22.4 23.1 24.5 25.7 28.5 34.6 38.5 43.0 55.6 71.3 77.8arrow_forward
- In a company with 80 employees, 60 earn $10.00 per hour and 20 earn $13.00 per hour. a) Determine the average hourly wage. b) In part a), is the same answer obtained if the 60 employees have an average wage of $10.00 per hour? Prove your answer.arrow_forwardThe following ordered data list shows the data speeds for cell phones used by a telephone company at an airport: A. Calculate the Measures of Central Tendency from the ungrouped data list. B. Group the data in an appropriate frequency table. 0.8 1.4 1.8 1.9 3.2 3.6 4.5 4.5 4.6 6.2 6.5 7.7 7.9 9.9 10.2 10.3 10.9 11.1 11.1 11.6 11.8 12.0 13.1 13.5 13.7 14.1 14.2 14.7 15.0 15.1 15.5 15.8 16.0 17.5 18.2 20.2 21.1 21.5 22.2 22.4 23.1 24.5 25.7 28.5 34.6 38.5 43.0 55.6 71.3 77.8arrow_forwardBusinessarrow_forward
- https://www.hawkeslearning.com/Statistics/dbs2/datasets.htmlarrow_forwardNC Current Students - North Ce X | NC Canvas Login Links - North ( X Final Exam Comprehensive x Cengage Learning x WASTAT - Final Exam - STAT → C webassign.net/web/Student/Assignment-Responses/submit?dep=36055360&tags=autosave#question3659890_9 Part (b) Draw a scatter plot of the ordered pairs. N Life Expectancy Life Expectancy 80 70 600 50 40 30 20 10 Year of 1950 1970 1990 2010 Birth O Life Expectancy Part (c) 800 70 60 50 40 30 20 10 1950 1970 1990 W ALT 林 $ # 4 R J7 Year of 2010 Birth F6 4+ 80 70 60 50 40 30 20 10 Year of 1950 1970 1990 2010 Birth Life Expectancy Ox 800 70 60 50 40 30 20 10 Year of 1950 1970 1990 2010 Birth hp P.B. KA & 7 80 % 5 H A B F10 711 N M K 744 PRT SC ALT CTRLarrow_forwardHarvard University California Institute of Technology Massachusetts Institute of Technology Stanford University Princeton University University of Cambridge University of Oxford University of California, Berkeley Imperial College London Yale University University of California, Los Angeles University of Chicago Johns Hopkins University Cornell University ETH Zurich University of Michigan University of Toronto Columbia University University of Pennsylvania Carnegie Mellon University University of Hong Kong University College London University of Washington Duke University Northwestern University University of Tokyo Georgia Institute of Technology Pohang University of Science and Technology University of California, Santa Barbara University of British Columbia University of North Carolina at Chapel Hill University of California, San Diego University of Illinois at Urbana-Champaign National University of Singapore McGill…arrow_forward
- Name Harvard University California Institute of Technology Massachusetts Institute of Technology Stanford University Princeton University University of Cambridge University of Oxford University of California, Berkeley Imperial College London Yale University University of California, Los Angeles University of Chicago Johns Hopkins University Cornell University ETH Zurich University of Michigan University of Toronto Columbia University University of Pennsylvania Carnegie Mellon University University of Hong Kong University College London University of Washington Duke University Northwestern University University of Tokyo Georgia Institute of Technology Pohang University of Science and Technology University of California, Santa Barbara University of British Columbia University of North Carolina at Chapel Hill University of California, San Diego University of Illinois at Urbana-Champaign National University of Singapore…arrow_forwardA company found that the daily sales revenue of its flagship product follows a normal distribution with a mean of $4500 and a standard deviation of $450. The company defines a "high-sales day" that is, any day with sales exceeding $4800. please provide a step by step on how to get the answers in excel Q: What percentage of days can the company expect to have "high-sales days" or sales greater than $4800? Q: What is the sales revenue threshold for the bottom 10% of days? (please note that 10% refers to the probability/area under bell curve towards the lower tail of bell curve) Provide answers in the yellow cellsarrow_forwardFind the critical value for a left-tailed test using the F distribution with a 0.025, degrees of freedom in the numerator=12, and degrees of freedom in the denominator = 50. A portion of the table of critical values of the F-distribution is provided. Click the icon to view the partial table of critical values of the F-distribution. What is the critical value? (Round to two decimal places as needed.)arrow_forward
arrow_back_ios
SEE MORE QUESTIONS
arrow_forward_ios
Recommended textbooks for you
 Holt Mcdougal Larson Pre-algebra: Student Edition...AlgebraISBN:9780547587776Author:HOLT MCDOUGALPublisher:HOLT MCDOUGAL
 Big Ideas Math A Bridge To Success Algebra 1: Stu...AlgebraISBN:9781680331141Author:HOUGHTON MIFFLIN HARCOURTPublisher:Houghton Mifflin Harcourt
 Glencoe Algebra 1, Student Edition, 9780079039897...AlgebraISBN:9780079039897Author:CarterPublisher:McGraw Hill
 College Algebra (MindTap Course List)AlgebraISBN:9781305652231Author:R. David Gustafson, Jeff HughesPublisher:Cengage Learning
Holt Mcdougal Larson Pre-algebra: Student Edition...
Algebra
ISBN:9780547587776
Author:HOLT MCDOUGAL
Publisher:HOLT MCDOUGAL
Big Ideas Math A Bridge To Success Algebra 1: Stu...
Algebra
ISBN:9781680331141
Author:HOUGHTON MIFFLIN HARCOURT
Publisher:Houghton Mifflin Harcourt
Glencoe Algebra 1, Student Edition, 9780079039897...
Algebra
ISBN:9780079039897
Author:Carter
Publisher:McGraw Hill
College Algebra (MindTap Course List)
Algebra
ISBN:9781305652231
Author:R. David Gustafson, Jeff Hughes
Publisher:Cengage Learning
Statistics 4.1 Point Estimators; Author: Dr. Jack L. Jackson II;https://www.youtube.com/watch?v=2MrI0J8XCEE;License: Standard YouTube License, CC-BY
Statistics 101: Point Estimators; Author: Brandon Foltz;https://www.youtube.com/watch?v=4v41z3HwLaM;License: Standard YouTube License, CC-BY
Central limit theorem; Author: 365 Data Science;https://www.youtube.com/watch?v=b5xQmk9veZ4;License: Standard YouTube License, CC-BY
Point Estimate Definition & Example; Author: Prof. Essa;https://www.youtube.com/watch?v=OTVwtvQmSn0;License: Standard Youtube License
Point Estimation; Author: Vamsidhar Ambatipudi;https://www.youtube.com/watch?v=flqhlM2bZWc;License: Standard Youtube License