
Introduction To Statistics And Data Analysis
6th Edition
ISBN: 9781337794503
Author: PECK
Publisher: Cengage
expand_more
expand_more
format_list_bulleted
Concept explainers
Videos
Textbook Question
Chapter 6.7, Problem 94E
Refer to the information given in Exercises 6.92 and 6.93.
- a. If two people are selected at random from this region, what is the estimated
probability that exactly one is a Caucasian? - b. If two people are selected at random from this region, what is the estimated probability that both are residents of the same county?
- c. If two people are selected at random from this region, what is the estimated probability that both are from different racial/ethnic groups?
6.92 On April 1, 2010, the Bureau of the Census in the United States attempted to count every U.S. resident. Suppose that the counts in the table given below are obtained for four counties in one region.
- a. If one person is selected at random from this region, what is the estimated probability that the selected person is from Ventura County?
- b. If one person is selected at random from Ventura County, what is the estimated probability that the selected person is Hispanic?
- c. If one Hispanic person is selected at random from this region, what is the estimated probability that the selected individual is from Ventura County?
- d. If one person is selected at random from this region, what is the estimated probability that the selected person is an Asian from San Luis Obispo County?
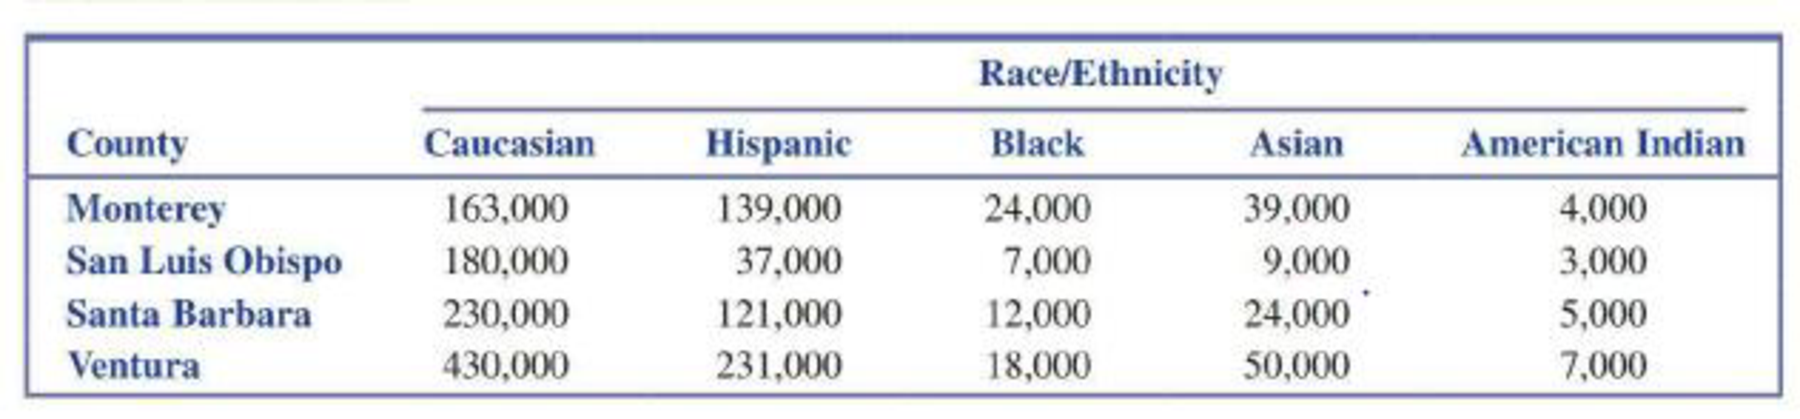
6.93 Refer to the information given in the previous exercise.
- a. If one person is selected at random from this region, what is the estimated probability that the person is either Asian or from San Luis Obispo County?
- b. If one person is selected at random from this region, what is the estimated probability that the person is Asian or from San Luis Obispo County but not both?
- c. If two people are selected at random from this region, what is the estimated probability that both are Caucasians?
If two people are selected at random from this region, what is the estimated probability that neither is Caucasian?
Expert Solution & Answer

Trending nowThis is a popular solution!

Students have asked these similar questions
A biologist is investigating the effect of potential plant
hormones by treating 20 stem segments. At the end of
the observation period he computes the following length
averages:
Compound X = 1.18
Compound Y = 1.17
Based on these mean values he concludes that there are
no treatment differences.
1) Are you satisfied with his conclusion? Why or why
not?
2) If he asked you for help in analyzing these data, what
statistical method would you suggest that he use to
come to a meaningful conclusion about his data and
why?
3) Are there any other questions you would ask him
regarding his experiment, data collection, and analysis
methods?
Business
What is the solution and answer to question?
Chapter 6 Solutions
Introduction To Statistics And Data Analysis
Ch. 6.1 - Define the term chance experiment, and give an...Ch. 6.1 - Define the term sample space, and then give the...Ch. 6.1 - Consider the chance experiment in which the type...Ch. 6.1 - Refer to the chance experiment described in the...Ch. 6.1 - A tennis shop sells five different brands of...Ch. 6.1 - Refer to the chance experiment described in the...Ch. 6.1 - A new model of laptop computer can be ordered with...Ch. 6.1 - A college library has four copies of a certain...Ch. 6.1 - A library has five copies of a certain textbook on...Ch. 6.1 - Suppose that, starting at a certain time,...
Ch. 6.1 - Refer to the previous exercise and now suppose...Ch. 6.1 - A family consisting of three peopleP1, P2, and...Ch. 6.1 - Prob. 13ECh. 6.1 - An engineering construction firm is currently...Ch. 6.1 - For the events described in the previous exercise,...Ch. 6.1 - Consider a Venn diagram picturing two events A and...Ch. 6.3 - A large department store offers online ordering....Ch. 6.3 - Consider the chance experiment described in the...Ch. 6.3 - The manager of an online music store has kept...Ch. 6.3 - Consider the chance experiment described in the...Ch. 6.3 - A bookstore sells two types of books (fiction and...Ch. 6.3 - Consider the chance experiment described in the...Ch. 6.3 - Medical insurance statuscovered (C) or not covered...Ch. 6.3 - Roulette is a game of chance that involves...Ch. 6.3 - Phoenix is a hub for a large airline. Suppose that...Ch. 6.3 - A customer satisfaction survey is planned. The...Ch. 6.3 - A professor assigns five problems to be completed...Ch. 6.3 - Refer to the following information on full-term...Ch. 6.3 - The report Teens, Social Media Technology...Ch. 6.3 - According to The Chronicle for Higher Education...Ch. 6.3 - The same issue of The Chronicle for Higher...Ch. 6.3 - A deck of 52 playing cards is mixed well, and 5...Ch. 6.3 - After all students have left the classroom, a...Ch. 6.3 - Use the information given in the previous exercise...Ch. 6.3 - The student council for a school of science and...Ch. 6.3 - A student placement center has requests from five...Ch. 6.3 - Suppose that a six-sided die is weighted so that...Ch. 6.4 - Two different airlines have a flight from Los...Ch. 6.4 - The article Chances Are You Know Someone with a...Ch. 6.4 - The accompanying data are from the article...Ch. 6.4 - Using the probabilities calculated in the previous...Ch. 6.4 - The following graphical display is similar to one...Ch. 6.4 - The article Americans Growing More Concerned About...Ch. 6.4 - The events E and T are defined as E = the event...Ch. 6.4 - The newspaper article Folic Acid Might Reduce Risk...Ch. 6.4 - Suppose that an individual is randomly selected...Ch. 6.4 - Is ultrasound a reliable method for determining...Ch. 6.4 - The paper Accuracy and Reliability of...Ch. 6.4 - The report 2015 Utah Seat Belt Use Survey (Utah...Ch. 6.4 - The National Highway Traffic Safety Administration...Ch. 6.4 - Use the information given in the previous exercise...Ch. 6.4 - The paper Good for Women, Good for Men, Bad for...Ch. 6.5 - Many fire stations handle emergency calls for...Ch. 6.5 - Refer to the information given in the previous...Ch. 6.5 - The paper Predictors of Complementary Therapy Use...Ch. 6.5 - The report TV Drama/Comedy Viewers and Health...Ch. 6.5 - The report Great Jobs, Great Lives. The...Ch. 6.5 - In a small city, approximately 15% of those...Ch. 6.5 - Jeanie is a bit forgetful, and if she doesnt make...Ch. 6.5 - Consider a system consisting of four components,...Ch. 6.5 - Consider the system described in the previous...Ch. 6.5 - In a January 2016 Harris Poll, each of 2252...Ch. 6.5 - Consider the following events: T = event that a...Ch. 6.5 - The following case study was reported in the...Ch. 6.5 - Three friends (A, B, and C) will participate in a...Ch. 6.5 - A store sells two different brands of dishwasher...Ch. 6.5 - The National Public Radio show Car Talk used to...Ch. 6.5 - Refer to the previous exercise. Suppose now that...Ch. 6.6 - A university has 10 vehicles available for use by...Ch. 6.6 - Prob. 70ECh. 6.6 - There are two traffic lights on Darlenes route...Ch. 6.6 - Let F denote the event that a randomly selected...Ch. 6.6 - According to a July 31, 2013 posting on cnn.com, a...Ch. 6.6 - Suppose that Blue Cab operates 15% of the taxis in...Ch. 6.6 - A large cable company reports the following: 80%...Ch. 6.6 - Refer to the information given in the previous...Ch. 6.6 - The authors of the paper Do Physicians Know When...Ch. 6.6 - A study of how people are using online services...Ch. 6.6 - The report Twitter in Higher Education: Usage...Ch. 6.6 - Use the information given in the previous exercise...Ch. 6.6 - Prob. 81ECh. 6.6 - Use the table of estimated probabilities from the...Ch. 6.6 - Suppose that we define the following events: C =...Ch. 6.6 - The article U.S. Investors Split Between Digital...Ch. 6.6 - Prob. 85ECh. 6.6 - The paper referenced in the previous exercise also...Ch. 6.6 - In an article that appears on the web site of the...Ch. 6.7 - The report Airline Quality Rating 2016...Ch. 6.7 - Five hundred first-year students at a state...Ch. 6.7 - Use the information given in the previous exercise...Ch. 6.7 - The table given below describes (approximately)...Ch. 6.7 - On April 1, 2010, the Bureau of the Census in the...Ch. 6.7 - Refer to the information given in the previous...Ch. 6.7 - Refer to the information given in Exercises 6.92...Ch. 6 - False positive results are not uncommon with...Ch. 6 - A company uses three different assembly linesA1,...Ch. 6 - Consider the following information about...Ch. 6 - Use the information given in the previous exercise...Ch. 6 - Use the information given in exercise 6.102 to...Ch. 6 - Prob. 105CRCh. 6 - The following table summarizing data on smoking...Ch. 6 - A study of the impact of seeking a second opinion...Ch. 6 - A company sends 40% of its overnight mail parcels...Ch. 6 - Prob. 109CRCh. 6 - Prob. 110CRCh. 6 - In a school machine shop, 60% of all machine...Ch. 6 - There are five faculty members in a certain...Ch. 6 - The general addition rule for three events states...Ch. 6 - A theater complex is currently showing four...Ch. 6 - Prob. 117CRCh. 6 - Suppose that a box contains 25 light bulbs, of...Ch. 6 - Return to Exercise 6.118, and suppose that 4 bulbs...Ch. 6 - A transmitter is sending a message using a binary...
Knowledge Booster


Learn more about
Need a deep-dive on the concept behind this application? Look no further. Learn more about this topic, statistics and related others by exploring similar questions and additional content below.Similar questions
- To: [Boss's Name] From: Nathaniel D Sain Date: 4/5/2025 Subject: Decision Analysis for Business Scenario Introduction to the Business Scenario Our delivery services business has been experiencing steady growth, leading to an increased demand for faster and more efficient deliveries. To meet this demand, we must decide on the best strategy to expand our fleet. The three possible alternatives under consideration are purchasing new delivery vehicles, leasing vehicles, or partnering with third-party drivers. The decision must account for various external factors, including fuel price fluctuations, demand stability, and competition growth, which we categorize as the states of nature. Each alternative presents unique advantages and challenges, and our goal is to select the most viable option using a structured decision-making approach. Alternatives and States of Nature The three alternatives for fleet expansion were chosen based on their cost implications, operational efficiency, and…arrow_forwardBusinessarrow_forwardWhy researchers are interested in describing measures of the center and measures of variation of a data set?arrow_forward
- WHAT IS THE SOLUTION?arrow_forwardThe following ordered data list shows the data speeds for cell phones used by a telephone company at an airport: A. Calculate the Measures of Central Tendency from the ungrouped data list. B. Group the data in an appropriate frequency table. C. Calculate the Measures of Central Tendency using the table in point B. 0.8 1.4 1.8 1.9 3.2 3.6 4.5 4.5 4.6 6.2 6.5 7.7 7.9 9.9 10.2 10.3 10.9 11.1 11.1 11.6 11.8 12.0 13.1 13.5 13.7 14.1 14.2 14.7 15.0 15.1 15.5 15.8 16.0 17.5 18.2 20.2 21.1 21.5 22.2 22.4 23.1 24.5 25.7 28.5 34.6 38.5 43.0 55.6 71.3 77.8arrow_forwardII Consider the following data matrix X: X1 X2 0.5 0.4 0.2 0.5 0.5 0.5 10.3 10 10.1 10.4 10.1 10.5 What will the resulting clusters be when using the k-Means method with k = 2. In your own words, explain why this result is indeed expected, i.e. why this clustering minimises the ESS map.arrow_forward
- why the answer is 3 and 10?arrow_forwardPS 9 Two films are shown on screen A and screen B at a cinema each evening. The numbers of people viewing the films on 12 consecutive evenings are shown in the back-to-back stem-and-leaf diagram. Screen A (12) Screen B (12) 8 037 34 7 6 4 0 534 74 1645678 92 71689 Key: 116|4 represents 61 viewers for A and 64 viewers for B A second stem-and-leaf diagram (with rows of the same width as the previous diagram) is drawn showing the total number of people viewing films at the cinema on each of these 12 evenings. Find the least and greatest possible number of rows that this second diagram could have. TIP On the evening when 30 people viewed films on screen A, there could have been as few as 37 or as many as 79 people viewing films on screen B.arrow_forwardQ.2.4 There are twelve (12) teams participating in a pub quiz. What is the probability of correctly predicting the top three teams at the end of the competition, in the correct order? Give your final answer as a fraction in its simplest form.arrow_forward
- The table below indicates the number of years of experience of a sample of employees who work on a particular production line and the corresponding number of units of a good that each employee produced last month. Years of Experience (x) Number of Goods (y) 11 63 5 57 1 48 4 54 5 45 3 51 Q.1.1 By completing the table below and then applying the relevant formulae, determine the line of best fit for this bivariate data set. Do NOT change the units for the variables. X y X2 xy Ex= Ey= EX2 EXY= Q.1.2 Estimate the number of units of the good that would have been produced last month by an employee with 8 years of experience. Q.1.3 Using your calculator, determine the coefficient of correlation for the data set. Interpret your answer. Q.1.4 Compute the coefficient of determination for the data set. Interpret your answer.arrow_forwardCan you answer this question for mearrow_forwardTechniques QUAT6221 2025 PT B... TM Tabudi Maphoru Activities Assessments Class Progress lIE Library • Help v The table below shows the prices (R) and quantities (kg) of rice, meat and potatoes items bought during 2013 and 2014: 2013 2014 P1Qo PoQo Q1Po P1Q1 Price Ро Quantity Qo Price P1 Quantity Q1 Rice 7 80 6 70 480 560 490 420 Meat 30 50 35 60 1 750 1 500 1 800 2 100 Potatoes 3 100 3 100 300 300 300 300 TOTAL 40 230 44 230 2 530 2 360 2 590 2 820 Instructions: 1 Corall dawn to tha bottom of thir ceraan urina se se tha haca nariad in archerca antarand cubmit Q Search ENG US 口X 2025/05arrow_forward
arrow_back_ios
SEE MORE QUESTIONS
arrow_forward_ios
Recommended textbooks for you
 Holt Mcdougal Larson Pre-algebra: Student Edition...AlgebraISBN:9780547587776Author:HOLT MCDOUGALPublisher:HOLT MCDOUGAL
 College Algebra (MindTap Course List)AlgebraISBN:9781305652231Author:R. David Gustafson, Jeff HughesPublisher:Cengage Learning
 Algebra & Trigonometry with Analytic GeometryAlgebraISBN:9781133382119Author:SwokowskiPublisher:Cengage
 College AlgebraAlgebraISBN:9781305115545Author:James Stewart, Lothar Redlin, Saleem WatsonPublisher:Cengage Learning
Holt Mcdougal Larson Pre-algebra: Student Edition...
Algebra
ISBN:9780547587776
Author:HOLT MCDOUGAL
Publisher:HOLT MCDOUGAL
College Algebra (MindTap Course List)
Algebra
ISBN:9781305652231
Author:R. David Gustafson, Jeff Hughes
Publisher:Cengage Learning
Algebra & Trigonometry with Analytic Geometry
Algebra
ISBN:9781133382119
Author:Swokowski
Publisher:Cengage
College Algebra
Algebra
ISBN:9781305115545
Author:James Stewart, Lothar Redlin, Saleem Watson
Publisher:Cengage Learning
Mod-01 Lec-01 Discrete probability distributions (Part 1); Author: nptelhrd;https://www.youtube.com/watch?v=6x1pL9Yov1k;License: Standard YouTube License, CC-BY
Discrete Probability Distributions; Author: Learn Something;https://www.youtube.com/watch?v=m9U4UelWLFs;License: Standard YouTube License, CC-BY
Probability Distribution Functions (PMF, PDF, CDF); Author: zedstatistics;https://www.youtube.com/watch?v=YXLVjCKVP7U;License: Standard YouTube License, CC-BY
Discrete Distributions: Binomial, Poisson and Hypergeometric | Statistics for Data Science; Author: Dr. Bharatendra Rai;https://www.youtube.com/watch?v=lHhyy4JMigg;License: Standard Youtube License