
Concept explainers
Videos
New Residences The average number of moves a person makes in his or her lifetime is 12. If the standard deviation is 3.2, find the
a. Less than 10
b. Greater than 10
c. Between 11 and 12
a.
To obtain: The probability that a random sample of 36 people is less than 10.
Answer to Problem 9E
The probability that a random sample of 36 people is less than 10 is 0.00009.
Explanation of Solution
Given info:
Average number of moves a person makes in his or her lifetime is
Calculations:
The random variable x represents number of moves of a person in his/her lifetime.
The notation
The formula for finding the z score using central limit theorem is,
Substitute 10 for
The probability that the mean of the selected sample will be less than 10 moves represents the area to the left of 3.75.
Software procedure:
Step-by-step procedure to obtain the probability using the MINITAB software:
- Choose Graph > Probability Distribution Plot choose View Probability> OK.
- From Distribution, choose ‘Normal’ distribution.
- Enter the Mean as 0.0 and Standard deviation as 1.0.
- Click the Shaded Area tab.
- Choose X value and Left Tail for the region of the curve to shade.
- Enter the X value as –3.75.
- Click OK.
- Output using the MINITAB software is given below:
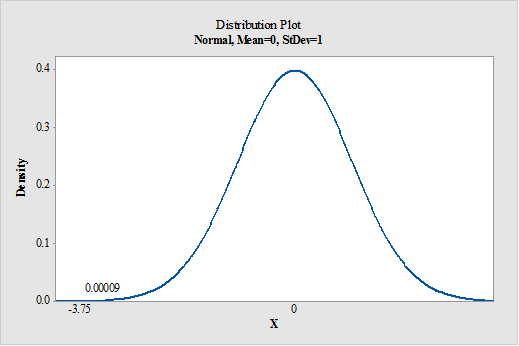
From MINITAB output, the probability that a random sample of 36 people is less than 10 is 0.00009.
- b.
To obtain: The probability that a random sample of 36 people is greater than 10.
Answer to Problem 9E
Probability will be 0.9999.
Explanation of Solution
Calculations:
The formula for finding the z score using central limit theorem is,
Substitute 10 for
The probability that a random sample of 36 people greater than 10 represents the area to the right of –3.75.
Software procedure:
Step-by-step procedure to obtain the probability using the MINITAB software:
- Choose Graph > Probability Distribution Plot choose View Probability> OK.
- From Distribution, choose ‘Normal’ distribution.
- Enter the Mean as 0.0 and Standard deviation as 1.0.
- Click the Shaded Area tab.
- Choose X value and Right Tail for the region of the curve to shade.
- Enter the X value as –3.75.
- Click OK.
- Output using the MINITAB software is given below:
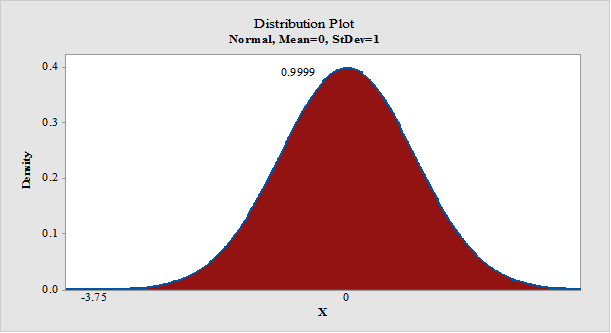
- From MINITAB output, the probability that a random sample of 36 people greater than 10 is 0.9999.
- c.
The probability that a random sample of 36 people between 11 and 12.
Answer to Problem 9E
The probability that a random sample of 36 people is between 11 and 12 is 0.4699.
Explanation of Solution
Calculations:
The formula for finding the z score using central limit theorem is,
Substitute 11 and 12 for
The probability that a random sample of 36 people is between 11 and 12 represents area between the value
Software procedure:
Step-by-step procedure to obtain the probability using the MINITAB software:
- Choose Graph > Probability Distribution Plot choose View Probability> OK.
- From Distribution, choose ‘Normal’ distribution.
- Enter the Mean as 0.0 and Standard deviation as 1.0.
- Click the Shaded Area tab.
- Choose X value and Middle for the region of the curve to shade.
- Enter the X value 1 as –1.88 and X value 2 as 0.
- Click OK.
- Output using the MINITAB software is given below:
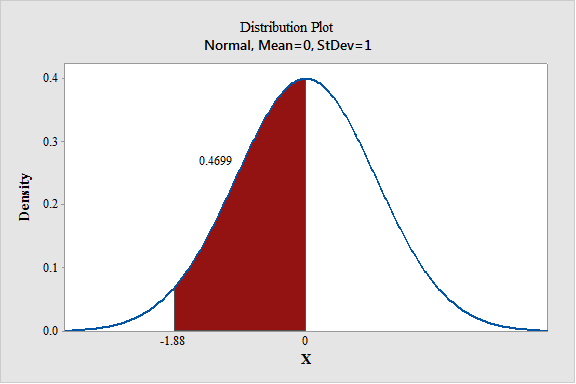
From MINITAB output, the probability that a random sample of 36 people is between 11 and 12 is 0.4699.
Want to see more full solutions like this?
Chapter 6 Solutions
Elementary Statistics: A Step By Step Approach


- Examine the Variables: Carefully review and note the names of all variables in the dataset. Examples of these variables include: Mileage (mpg) Number of Cylinders (cyl) Displacement (disp) Horsepower (hp) Research: Google to understand these variables. Statistical Analysis: Select mpg variable, and perform the following statistical tests. Once you are done with these tests using mpg variable, repeat the same with hp Mean Median First Quartile (Q1) Second Quartile (Q2) Third Quartile (Q3) Fourth Quartile (Q4) 10th Percentile 70th Percentile Skewness Kurtosis Document Your Results: In RStudio: Before running each statistical test, provide a heading in the format shown at the bottom. “# Mean of mileage – Your name’s command” In Microsoft Word: Once you've completed all tests, take a screenshot of your results in RStudio and paste it into a Microsoft Word document. Make sure that snapshots are very clear. You will need multiple snapshots. Also transfer these results to the…arrow_forward2 (VaR and ES) Suppose X1 are independent. Prove that ~ Unif[-0.5, 0.5] and X2 VaRa (X1X2) < VaRa(X1) + VaRa (X2). ~ Unif[-0.5, 0.5]arrow_forward8 (Correlation and Diversification) Assume we have two stocks, A and B, show that a particular combination of the two stocks produce a risk-free portfolio when the correlation between the return of A and B is -1.arrow_forward
- 9 (Portfolio allocation) Suppose R₁ and R2 are returns of 2 assets and with expected return and variance respectively r₁ and 72 and variance-covariance σ2, 0%½ and σ12. Find −∞ ≤ w ≤ ∞ such that the portfolio wR₁ + (1 - w) R₂ has the smallest risk.arrow_forward7 (Multivariate random variable) Suppose X, €1, €2, €3 are IID N(0, 1) and Y2 Y₁ = 0.2 0.8X + €1, Y₂ = 0.3 +0.7X+ €2, Y3 = 0.2 + 0.9X + €3. = (In models like this, X is called the common factors of Y₁, Y₂, Y3.) Y = (Y1, Y2, Y3). (a) Find E(Y) and cov(Y). (b) What can you observe from cov(Y). Writearrow_forward1 (VaR and ES) Suppose X ~ f(x) with 1+x, if 0> x > −1 f(x) = 1−x if 1 x > 0 Find VaRo.05 (X) and ES0.05 (X).arrow_forward
- Joy is making Christmas gifts. She has 6 1/12 feet of yarn and will need 4 1/4 to complete our project. How much yarn will she have left over compute this solution in two different ways arrow_forwardSolve for X. Explain each step. 2^2x • 2^-4=8arrow_forwardOne hundred people were surveyed, and one question pertained to their educational background. The results of this question and their genders are given in the following table. Female (F) Male (F′) Total College degree (D) 30 20 50 No college degree (D′) 30 20 50 Total 60 40 100 If a person is selected at random from those surveyed, find the probability of each of the following events.1. The person is female or has a college degree. Answer: equation editor Equation Editor 2. The person is male or does not have a college degree. Answer: equation editor Equation Editor 3. The person is female or does not have a college degree.arrow_forward
 Glencoe Algebra 1, Student Edition, 9780079039897...AlgebraISBN:9780079039897Author:CarterPublisher:McGraw Hill
 Holt Mcdougal Larson Pre-algebra: Student Edition...AlgebraISBN:9780547587776Author:HOLT MCDOUGALPublisher:HOLT MCDOUGAL
 Big Ideas Math A Bridge To Success Algebra 1: Stu...AlgebraISBN:9781680331141Author:HOUGHTON MIFFLIN HARCOURTPublisher:Houghton Mifflin Harcourt