Videos
On average, every minute of every day, 158 babies are born. The bar graph represents the results of a single day of births, deaths, and population increase worldwide. Exercises 25-26 are based on the information displayed by the graph.
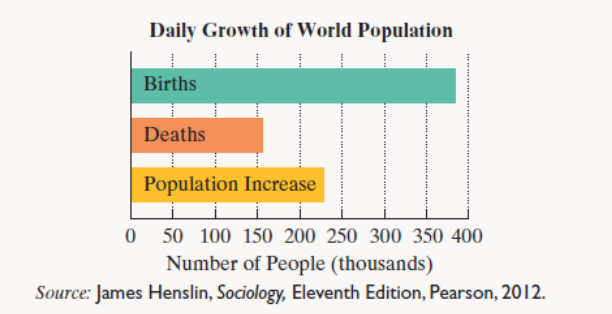
Each day, the number of births in the world exceeds twice the number of deaths by 72 thousand.
a. If the population increase in a single day is 228 thousand, determine the number of birth and deaths per day.
b. If the population increase in a single day is 228 thousand, by how many millions of people does the worldwide population increase each year? Round to the nearest million.
c. Based on your answer to part (b), approximately how many years does it take for the population of the world to increase by an amount greater than the entire U.S. population (315 million)?
Want to see the full answer?
Check out a sample textbook solution
Chapter 6 Solutions
Thinking Mathematically plus NEW MyLab Math with Pearson eText -- Access Card Package (6th Edition)
Additional Math Textbook Solutions
Algebra and Trigonometry (6th Edition)
Introductory Statistics
Elementary Statistics: A Step By Step Approach
Elementary Statistics: Picturing the World (7th Edition)
College Algebra (7th Edition)
Finite Mathematics for Business, Economics, Life Sciences and Social Sciences


- Graph y= log(x − 1) +4 10+ 9 8 7 6 5 4 32 1 10 -9 -8 -7 -6 -5 -4 -3 -2 -1 1 2 3 4 5 -1 6 7 8 9 10 -2 -3 -4 -5 -6 -7 -8 -9 -10arrow_forwardNo chatgpt pls will upvote Already got wrong chatgpt answerarrow_forwardLacy is a single taxpayer. In 2024, her taxable income is $56,000. What is her tax liability in each of the following alternative situations. All of her income is salary from her employer. What is her tax liability?arrow_forward
- Write an equation for the graph shown below. 5 4 3 2 1 -5-4-3-2-1 -1 1 2 3 4 5 f(x) = -2 -3 -4 -5arrow_forwardN = mg Ö == 6 mL mL - - (Ö sin(0) – ė² cos(0)) 2 - (N) * (µ cos(0) − sin(0)) 12 * g * cos(0) = 12g L + (3 * cos(0)) L mL μ * N = - (Ö cos(0) – 0² sin(0)) 2 Solve for mu in terms of theta, fully simplify (a lot of algebra) should get mu = function(theta)arrow_forward1. We want to graph the function f(x) log4 x. In a table below, = find at three points with nice integer y-values (no rounding!) and then graph the function at right. Be sure to clearly indicate any asymptotes. (4 points) 3 2 1- -1 0 1 2 3 4 5 10 X log4(x) -1 -2 -3- 6 7 8 00arrow_forward
- Graph y=log2(x+3) 10+ 9 8 7- 6 5 4 3 3 2 1 10 -9 -8 -7 -6 -5 -4 -3-2-1 1 2 3 4 5 6 7 8 7 8 9 10 -1 -2 -3 -4 -5 -6 -7- -8 -9 -10 Clear All Drawarrow_forwardWrite an equation for the graph below. +10+ 9 10 -9 -8 -7 -6 -5 -4 -3-2-1 8 7 6 5 4 3 2 1 1 3 4 5 6 7 8 9 10 -1 -2 -3 -4 -5 -6 -7 -8 f(x) = 9 -9 -10-arrow_forward3. Solve the inequality and give your answer in interval notation. Be sure to show all your work, and write neatly so your work is easy to follow. (4 points) 2|3x+12 ≥ 18arrow_forward
- - 2. In words, interpret the inequality |x8|> 7 the same way I did in the videos. Note: the words "absolute value" should not appear in your answer! (2 points)arrow_forward1. Define probability: 2. Define statistics:arrow_forwarde nearest tenth. =15 2. A = 33°, B = 29°, b = 41 -b SINA" 2c Sina SinB Sin C 4. A = 30°, B = 45°, a = 10arrow_forward
 Algebra: Structure And Method, Book 1AlgebraISBN:9780395977224Author:Richard G. Brown, Mary P. Dolciani, Robert H. Sorgenfrey, William L. ColePublisher:McDougal Littell
 Holt Mcdougal Larson Pre-algebra: Student Edition...AlgebraISBN:9780547587776Author:HOLT MCDOUGALPublisher:HOLT MCDOUGAL
 Glencoe Algebra 1, Student Edition, 9780079039897...AlgebraISBN:9780079039897Author:CarterPublisher:McGraw Hill
 Mathematics For Machine TechnologyAdvanced MathISBN:9781337798310Author:Peterson, John.Publisher:Cengage Learning,
 Algebra & Trigonometry with Analytic GeometryAlgebraISBN:9781133382119Author:SwokowskiPublisher:Cengage