Concept explainers

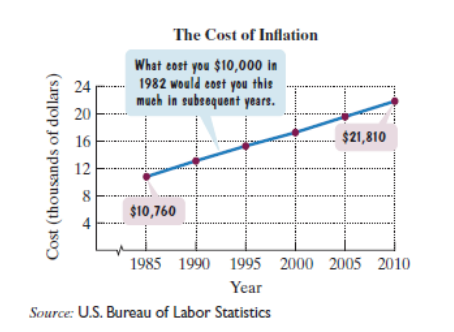
Here are two mathematical models for the data shown by the graph. In each formula, C represents the cost x years after 1985 of what cost $10,000 in 1982.

a. Use the graph to estimate the cost in 1995, to the nearest thousand dollars, of what cost $10,000 in 1982.
b. Use model 1 to determine the cost in 1995. How well does this describe your estimate from part (a)?
c. Use model 2 to determine the cost in 1995. How well does this describe your estimate from part (a)?
d. Use model 1 to determine in which year the cost will be $28,320 for what cost $10,000 in 1982.
The line graph shows the cost of inflation. What cost $10,000 in 1982 would cost the amount shown by the graph in subsequent years.
Want to see the full answer?
Check out a sample textbook solution
Chapter 6 Solutions
Thinking Mathematically plus NEW MyLab Math with Pearson eText -- Access Card Package (6th Edition)
- Scenario Sales of products by color follow a peculiar, but predictable, pattern that determines how many units will sell in any given year. This pattern is shown below Product Color 1995 1996 1997 Red 28 42 21 1998 23 1999 29 2000 2001 2002 Unit Sales 2003 2004 15 8 4 2 1 2005 2006 discontinued Green 26 39 20 22 28 14 7 4 2 White 43 65 33 36 45 23 12 Brown 58 87 44 48 60 Yellow 37 56 28 31 Black 28 42 21 Orange 19 29 Purple Total 28 42 21 49 68 78 95 123 176 181 164 127 24 179 Questions A) Which color will sell the most units in 2007? B) Which color will sell the most units combined in the 2007 to 2009 period? Please show all your analysis, leave formulas in cells, and specify any assumptions you make.arrow_forward5. (20%) The linear transformation L: P3 → P2 defined by L(f(x)) = f'(x)+ f(0). (a) Find the representing matrix A of L with respect to the ordered basis {x2, x, 1} for P3, and the ordered basis {2,1 - x} for P2. (b) Find the coordinates of the f(x) = 2x² +2 in P3 with respect to the ordered basis {x2,-x, 1}, and find the coordinates of L(f(x)) with respect to the ordered basis {2,1-x}arrow_forwardOne hundred students were surveyed about their preference between dogs and cats. The following two-way table displays data for the sample of students who responded to the survey. Preference Male Female TOTAL Prefers dogs \[36\] \[20\] \[56\] Prefers cats \[10\] \[26\] \[36\] No preference \[2\] \[6\] \[8\] TOTAL \[48\] \[52\] \[100\] problem 1 Find the probability that a randomly selected student prefers dogs.Enter your answer as a fraction or decimal. \[P\left(\text{prefers dogs}\right)=\] Incorrect Check Hide explanation Preference Male Female TOTAL Prefers dogs \[\blueD{36}\] \[\blueD{20}\] \[\blueE{56}\] Prefers cats \[10\] \[26\] \[36\] No preference \[2\] \[6\] \[8\] TOTAL \[48\] \[52\] \[100\] There were \[\blueE{56}\] students in the sample who preferred dogs out of \[100\] total students.arrow_forward
- For the spinner below, assume that the pointer can never lie on a borderline. Find the following probabilities. (enter the probabilities as fractions)arrow_forwardEvaluate the following integrals as they are writtenarrow_forwardFind the values of x, y, and z. Round to the nearest tenth, if necessary. 8, 23arrow_forward
- 11 In the Pharlemina's Favorite quilt pattern below, vega-pxe-frame describe a motion that will take part (a) green to part (b) blue. Part (a) Part (b)arrow_forwardBusiness discussarrow_forward(c) Describe the distribution plan and show the total distribution cost. Optimal Solution Amount Cost $ 2000 Southern-Hamilton 200 Southern-Butler $ Southern-Clermont 300 4500 Northwest-Hamilton 200 $2400 Northwest-Butler 200 $3000 Northwest-Clermont $ Total Cost ક (d) Recent residential and industrial growth in Butler County has the potential for increasing demand by 100 units. (i) Create an updated distribution plan assuming Southern Gas becomes the preferred supplier. Distribution Plan with Southern Gas Amount Southern-Hamilton $ Cost × Southern-Butler x $ Southern-Clermont 300 $ 4500 Northwest-Hamilton 64 x Northwest-Butler $ × Northwest-Clermont 0 $0 Total Cost $ (ii) Create an updated distribution plan assuming Northwest Gas becomes the preferred supplier. Distribution Plan with Northwest Gas Southern-Hamilton Southern-Butler 0 Southern-Clermont Northwest-Hamilton Northwest-Butler Northwest-Clermont Total Cost Amount × x x +7 $0 Cost × $ × $ × +4 $ -/+ $ × ×arrow_forward
- The distribution system for the Herman Company consists of three plants, two warehouses, and four customers. Plant capacities and shipping costs per unit (in $) from each plant to each warehouse are as follows. Warehouse Plant Capacity 1 2 1 4 7 450 2 8 5 600 3 5 6 380 Customer demand and shipping costs per unit (in $) from each warehouse to each customer are as follows. Customer Warehouse 1 2 3 1 6 4 8 2 3 6 7 7 Demand 300 300 300 400 (a) Develop a network representation of this problem. (Submit a file with a maximum size of 1 MB.) Choose File No file chosen This answer has not been graded yet. (b) Formulate a linear programming model of the problem. (Let Plant 1 be node 1, Plant 2 be node 2, Plant 3 be node 3, Warehouse 1 be node 4, Warehouse 2 be node 5, Customer 1 be node 6, Customer 2 be node 7, Customer 3 be node 8, and Customer 4 be node 9. Express your answers in the form x;;, where x,; represents the number of units shipped from node i to node j.) Min 4x14+8x24+5x34+7x15 +5x25…arrow_forwardA linear programming computer package is needed. Hanson Inn is a 96-room hotel located near the airport and convention center in Louisville, Kentucky. When a convention or a special event is in town, Hanson increases its normal room rates and takes reservations based on a revenue management system. A large profesional organization has scheduled its annual convention in Louisville for the first weekend in June. Hanson Inn agreed to make at least 50% of its rooms available for convention attendees at a special convention rate in order to be listed as a recommended hotel for the convention. Although the majority of attendees at the annual meeting typically request a Friday and Saturday two-night package, some attendees may select a Friday night only or a Saturday night only reservation. Customers not attending the convention may also request a Friday and Saturday two-night package, or make a Friday night only or Saturday night only reservation. Thus, six types of reservations are…arrow_forwardQuestions 1. Identify and describe potential bias in the study. 2. Identify and describe the way in which the selected participants may or may not represent the population as a whole. 3. Identify and describe the possible problems with the end results since the majority will be from females rather than an even split. 4. Identify and describe the possible problems with identifying females as possibly more vulnerable based on the data collected. 5. Identify a possible null hypothesis and problems in how the study might address this null hypothesis. 6. Identify one possible method of improving the study design and describe how it would improve the validity of the conclusions. 7. Identify a second possible method of improving the study design and describe how it would improve the validity of the conclusions.arrow_forward
 Trigonometry (MindTap Course List)TrigonometryISBN:9781337278461Author:Ron LarsonPublisher:Cengage Learning
 Glencoe Algebra 1, Student Edition, 9780079039897...AlgebraISBN:9780079039897Author:CarterPublisher:McGraw Hill
 Algebra: Structure And Method, Book 1AlgebraISBN:9780395977224Author:Richard G. Brown, Mary P. Dolciani, Robert H. Sorgenfrey, William L. ColePublisher:McDougal LittellAlgebra & Trigonometry with Analytic GeometryAlgebraISBN:9781133382119Author:SwokowskiPublisher:Cengage


