
Concept explainers
Videos
A shop works a 400-minute day. The manager of the shop wants an output of 200 units per day for the assembly line that has the elemental tasks shown in the table. Do the following:
a. Construct the precedence diagram.
b. Assign tasks according to the most following tasks rule. Break ties with the greatest positional weight rule.
c. Assign tasks according to the greatest positional weight rule. Break ties with the most following tasks rule.
d. Compute the balance delay for each rule. Which one yields the better set of assignments in this instance?
a)
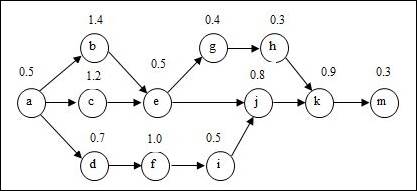
To draw: The precedence diagram.
Introduction:
Process selection:
It is the tactical choices made by a firm in picking the kind of production procedure to be followed in the process of production. The process is selected after reviewing many numbers of criteria and constraints.
Answer to Problem 8P
Precedence diagram:
Explanation of Solution
Given information:
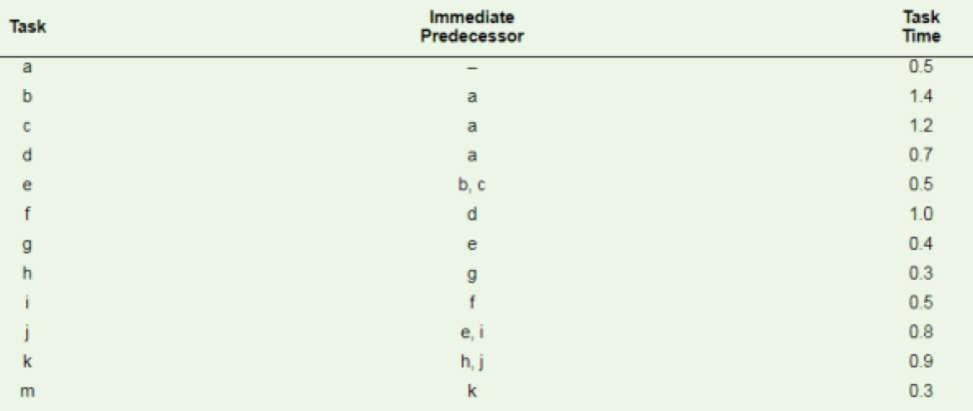
| Task | Task time (Minutes) | Immediate predecessor |
| a | 0.5 | Nil |
| b | 1.4 | a |
| c | 1.2 | a |
| d | 0.7 | a |
| e | 0.5 | b, c |
| f | 1 | d |
| g | 0.4 | e |
| h | 0.3 | g |
| i | 0.5 | f |
| j | 0.8 | e, i |
| k | 0.9 | h, j |
| m | 0.3 | k |
Number of minutes per day = 400
Desired output per day = 200 units
Precedence diagram:
The precedence diagram is drawn circles and arrows. The tasks are represented in circles and weights for each task are represented outside the circle. The arrows are represented to show which task is preceding the other task and so on.
b)
To assign: Tasks on the basis of most following tasks.
Introduction:
Process selection:
It is the tactical choices made by a firm in picking the kind of production procedure to be followed in the process of production. The process is selected after reviewing many numbers of criteria and constraints.
Explanation of Solution
Given information:
| Task | Task time (Minutes) | Immediate predecessor |
| a | 0.5 | Nil |
| b | 1.4 | a |
| c | 1.2 | a |
| d | 0.7 | a |
| e | 0.5 | b, c |
| f | 1 | d |
| g | 0.4 | e |
| h | 0.3 | g |
| i | 0.5 | f |
| j | 0.8 | e, i |
| k | 0.9 | h, j |
| m | 0.3 | k |
Number of minutes per day = 400
Desired output per day = 200 units
Calculation of cycle time:
The cycle time is calculated by dividing the operating time per day by the desired output per day.
The number of following tasks, calculation of positional weight for each task is shown below.
| Task | Following tasks | Number of following tasks | Calculation of positional weight | Positional weight |
| a | b, c, d, e, f, g, h, i, j, k, m | 11 | 0.5 + 1.4 + 1.2 + 0.7 + 0.5 + 1 + 0.4 + 0.3 + 0.5 + 0.8 + 0.9 + 0.3 | 8.5 |
| b | e, g, h, j, k, m | 6 | 1.4 + 0.5 + 0.4 + 0.3 + 0.8 + 0.9 + 0.3 | 4.6 |
| c | e, g, h, j, k, m | 6 | 1.2 + 0.5 + 0.4 + 0.3 + 0.8 + 0.9 + 0.3 | 4.4 |
| d | f, i, j, k, m | 5 | 0.7 + 1 + 0.5 + 0.8 + 0.9 + 0.3 | 4.2 |
| e | g, h, j, k, m | 5 | 0.5 + 0.4 + 0.3 + 0.8+ 0.9 + 0.3 | 3.2 |
| f | i, j, k, m | 4 | 1 + 0.5 + 0.8 + 0.9 + 0.3 | 3.5 |
| g | h, k, m | 3 | 0.4 + 0.3 + 0.9 + 0.3 | 1.9 |
| h | k, m | 2 | 0.3 + 0.9 + 0.3 | 1.5 |
| i | j, k, m | 3 | 0.5 + 0.8 0.9 + 0.3 | 2.5 |
| j | k, m | 2 | 0.8 + 0.9 + 0.3 | 2 |
| k | m | 1 | 0.9 + 0.3 | 1.2 |
| m | Nil | 0 | 0.3 | 0.3 |
Assigning tasks to workstations:
| Workstation number | Eligible task | Assigned task | Task time | Unassigned cycle time | Reason |
| 2 | |||||
| 1 | a | a | 0.5 | 1.5 | Task 'a' is the only eligible task available |
| b, c, d | b | 1.4 | 0.1 | Task 'b' has the highest positional weight | |
| c, d | None | 0.1 (Idle time) | The task time is greater than the unassigned cycle time. | ||
| 2 | |||||
| 2 | c, d | c | 1.2 | 0.8 | Task 'c' has more following tasks |
| d, e | d | 0.7 | 0.1 | Task 'd' has the highest positional weight | |
| e, f | None | 0.1 (Idle time) | The task time is greater than the unassigned cycle time. | ||
| 2 | |||||
| 3 | e, f | e | 0.5 | 1.5 | Task 'e' has more following tasks |
| f, g | f | 1 | 0.5 | Task 'f' has more following tasks | |
| g, i | i | 0.5 | 0 | Task 'i' has the highest positional weight | |
| 2 | |||||
| 4 | g, j | g | 0.4 | 1.6 | Task 'g' has more following tasks |
| h, j | j | 0.8 | 0.8 | Task 'j' has the highest positional weight | |
| h | h | 0.3 | 0.5 | Task 'h' is the only eligible task available | |
| k | None | 0.5 (Idle time) | The task time is greater than the unassigned cycle time. | ||
| 2 | |||||
| 5 | k | k | 0.9 | 1.1 | Task 'k' is the only eligible task available |
| m | m | 0.3 | 0.8 | Task 'm' is the only task remaining | |
| 0.8 (Idle time) | All tasks completed |
Overview of tasks assignment:
| Workstation | Assigned tasks | Total cycle time used | Idle time |
| 1 | a, b | 1.9 | 0.1 |
| 2 | c, d | 1.9 | 0.1 |
| 3 | e, f, i | 2 | 0 |
| 4 | g, j, h | 1.5 | 0.5 |
| 5 | k, m | 1.2 | 0.8 |
c)
To assign: Tasks on the basis of greatest positional weight.
Introduction:
Process selection:
It is the tactical choices made by a firm in picking the kind of production procedure to be followed in the process of production. The process is selected after reviewing many numbers of criteria and constraints.
Explanation of Solution
Given information:
| Task | Task time (Minutes) | Immediate predecessor |
| a | 0.5 | Nil |
| b | 1.4 | a |
| c | 1.2 | a |
| d | 0.7 | a |
| e | 0.5 | b, c |
| f | 1 | d |
| g | 0.4 | e |
| h | 0.3 | g |
| i | 0.5 | f |
| j | 0.8 | e, i |
| k | 0.9 | h, j |
| m | 0.3 | k |
Number of minutes per day = 400
Desired output per day = 200 units
Calculation of cycle time:
The cycle time is calculated by dividing the operating time per day by the desired output per day.
The number of following tasks, calculation of positional weight for each task is shown below.
| Task | Following tasks | Number of following tasks | Calculation of positional weight | Positional weight |
| a | b, c, d, e, f, g, h, i, j, k, m | 11 | 0.5 + 1.4 + 1.2 + 0.7 + 0.5 + 1 + 0.4 + 0.3 + 0.5 + 0.8 + 0.9 + 0.3 | 8.5 |
| b | e, g, h, j, k, m | 6 | 1.4 + 0.5 + 0.4 + 0.3 + 0.8 + 0.9 + 0.3 | 4.6 |
| c | e, g, h, j, k, m | 6 | 1.2 + 0.5 + 0.4 + 0.3 + 0.8 + 0.9 + 0.3 | 4.4 |
| d | f, i, j, k, m | 5 | 0.7 + 1 + 0.5 + 0.8 + 0.9 + 0.3 | 4.2 |
| e | g, h, j, k, m | 5 | 0.5 + 0.4 + 0.3 + 0.8+ 0.9 + 0.3 | 3.2 |
| f | i, j, k, m | 4 | 1 + 0.5 + 0.8 + 0.9 + 0.3 | 3.5 |
| g | h, k, m | 3 | 0.4 + 0.3 + 0.9 + 0.3 | 1.9 |
| h | k, m | 2 | 0.3 + 0.9 + 0.3 | 1.5 |
| i | j, k, m | 3 | 0.5 + 0.8 0.9 + 0.3 | 2.5 |
| j | k, m | 2 | 0.8 + 0.9 + 0.3 | 2 |
| k | m | 1 | 0.9 + 0.3 | 1.2 |
| m | Nil | 0 | 0.3 | 0.3 |
Assigning tasks to workstations:
| Workstation number | Eligible task | Assigned task | Task time | Unassigned cycle time | Reason |
| 2 | |||||
| 1 | a | a | 0.5 | 1.5 | Task 'a' is the only eligible task available |
| b, c, d | b | 1.4 | 0.1 | Task 'b' has the highest positional weight | |
| c, d | None | 0.1 (Idle time) | The task time is greater than the unassigned cycle time. | ||
| 2 | |||||
| 2 | c, d | c | 1.2 | 0.8 | Task 'c' has the highest positional weight |
| d, e | d | 0.7 | 0.1 | Task 'd' has the highest positional weight | |
| e, f | None | 0.1 (Idle time) | The task time is greater than the unassigned cycle time. | ||
| 2 | |||||
| 3 | e, f | f | 1 | 1 | Task 'f' has the highest positional weight |
| e, i | e | 0.5 | 0.5 | Task 'e' has the highest positional weight | |
| g, i | i | 0.5 | 0 | Task 'g' has the highest positional weight | |
| 2 | |||||
| 4 | g, j | j | 0.8 | 1.2 | Task 'j' has the highest positional weight |
| g | g | 0.4 | 0.8 | Task 'g' is the only eligible task available | |
| h | h | 0.3 | 0.5 | Task 'h' is the only eligible task available | |
| k | None | 0.5 (Idle time) | The task time is greater than the unassigned cycle time. | ||
| 2 | |||||
| 5 | k | k | 0.9 | 1.1 | Task 'k' is the only eligible task available |
| m | m | 0.3 | 0.8 | Task 'm' is the only task remaining | |
| 0.8 (Idle time) | All tasks completed |
Overview of tasks assignment:
| Workstation | Assigned tasks | Total cycle time used | Idle time |
| 1 | a, b | 1.9 | 0.1 |
| 2 | c, d | 1.9 | 0.1 |
| 3 | f, e, i | 2 | 0 |
| 4 | j, g, h | 1.5 | 0.5 |
| 5 | k, m | 1.2 | 0.8 |
d)
To determine: The balance delay.
Introduction:
Process selection:
It is the tactical choices made by a firm in picking the kind of production procedure to be followed in the process of production. The process is selected after reviewing many numbers of criteria and constraints.
Answer to Problem 8P
Explanation of Solution
The balance delay is also known as the percentage of idle time.
Formula to calculate percentage of idle time:
Calculation of percentage of idle time:
Most following tasks:
The percentage of idle time is 15%.
Greatest positional weight:
The percentage of idle time is 15%.
The balance delay for most following tasks and greatest positional weight rule is 15%.
Want to see more full solutions like this?
Chapter 6 Solutions
EBK OPERATIONS MANAGEMENT


- Prepare a master schedule given this information: The forecast for each week of an eight-week schedule is 60 units. The MPS rule is to schedule production if the projected on-hand Inventory would be negative without it. Customer orders (committed) are as follows: Week Customer Orders 1 2 36 28 4 1 Use a production lot size of 85 units and no beginning inventory. Note: In the ATP row, enter a value of 0 (zero) in any periods where ATP should not be calculated. Leave no cells blank - be certain to enter "0" wherever required. June July 1 2 3 4 5 8 7 8 Forecast 60 60 60 60 60 60 60 60 Customer Orders 38 28 4 1 0 0 0 0 Projected On-Hand Inventory MPS ATParrow_forwardSales of tablet computers at Marika Gonzalez's electronics store in Washington, D.C., over the past 10 weeks are shown in the table below: Week 1 2 3 4 5 6 7 8 9 10 Demand 21 21 27 38 25 30 35 24 25 30 a) The forecast for weeks 2 through 10 using exponential smoothing with a = 0.50 and a week 1 initial forecast of 21.0 are (round your responses to two decimal places): Week 1 2 3 4 5 6 7 8 9 10 Demand 21 21 27 38 25 30 35 24 25 30 Forecast 21.0 21 21 24 31 28 29 32 28 26.50 b) For the forecast developed using exponential smoothing (a = 0.50 and initial forecast 21.0), the MAD = |||||sales (round your response to two decimal places).arrow_forwardSales of tablet computers at Marika Gonzalez's electronics store in Washington, D.C., over the past 10 weeks are shown in the table below: Week Demand 1 2 3 4 5 6 7 8 9 10 21 21 27 38 25 30 35 24 25 30 a) The forecast for weeks 2 through 10 using exponential smoothing with a = 0.50 and a week 1 initial forecast of 21.0 are (round your responses to two decimal places): Week 1 2 3 4 5 Demand 21 21 27 38 Forecast 21.0 ☐ G ☐ ☐ 6 7 25 30 35 ∞ ☐ 8 9 10 24 25 30arrow_forward
- Each machine costs $3 Million. Building the room with all its attendant safety protection and other ancillary costs increases the spending by an additional $2.0 million dollars per MRI suite. Each machine can perform 2000 scans per year. Each reading of an MRI scan by a radiologist, along with other per-scan-related costs, is $500 per scan. The machine will last five years. Don’t worry about discount rates for this problem Graph the total costs over 5 years as a function of sales for 0-3000 patients annually. Hint: you may need to add a second MRI at some point. Suppose that you want to make a profit of $500 per scan at a target volume of 1000 patients per year, and you purchase only one machine. Superimpose the total revenue curve on top of the total cost curve in (1).arrow_forwardI need the answer to requirement C.arrow_forwardImagine you are Susan Kim and are faced with a difficult choice to either follow the orders she was given, or refusing to do so. Using each lens determine what the ethical response would be. Suppot your answer with materials from readings and lectures. For example, using Universalism what would the ethical response be? Do the same for all four lenses.arrow_forward
- Answer all these questions, selecting any company of your choice. Choose a specific type of food company. Select a specific product. Develop all the inputs that are part of the process. Develop the transformation process in a graphic (diagram, etc.). Develop all the outputs or finished products that are part of the process. Describe all the processes involved in one line of production in any manufacturing facility. Also describing how good management is the center of any part of a production company.arrow_forwardUsing exponential smoothing with α =0.2, forecast the demand for The initial forecast for January is 2000 tons. Calculate the capacity utilization for June, July and Discuss the implications of underutilized or over utilized capacity for Green Harvestarrow_forwardIn organizational development when results are improving but relationships are declining, what leadership style is appropriate? directing delegating supporting coachingarrow_forward
- What is the first thing a leader should do when moving through a cultural change? conduct an assessment comparing the practices to other high-performing organizations learn about the current organizational culture continue to monitor key metrics define expectationsarrow_forwardThe third change leadership strategy, Collaborate on Implementation, is designed to address what type of concerns? impact concerns personal concerns refinement concerns collaboration concernsarrow_forwardIf team members are concerned with specifics such as their tasks, contingency plans, resources, and timeline, what concerns do they have? implementation concerns impact concerns refinement concerns personal concernsarrow_forward
 Practical Management ScienceOperations ManagementISBN:9781337406659Author:WINSTON, Wayne L.Publisher:Cengage,
 MarketingMarketingISBN:9780357033791Author:Pride, William MPublisher:South Western Educational Publishing
 Purchasing and Supply Chain ManagementOperations ManagementISBN:9781285869681Author:Robert M. Monczka, Robert B. Handfield, Larry C. Giunipero, James L. PattersonPublisher:Cengage Learning