
Concept explainers
Videos
For the given set of tasks, do the following:
a. Develop the precedence diagram
b. Determine the minimum cycle time and then calculate the cycle time for a desired output of 500 units in a seven-hour day. Why might a manager use a cycle tune of 50 seconds?
c. Determine the minimum number of workstations for output of 500 units per day
d. Balance the line using the greatest positional weight heuristic. Break ties with the most following tasks heuristic. Use a cycle tune of 50 seconds.
e. Calculate the percentage idle time for the line.
a)
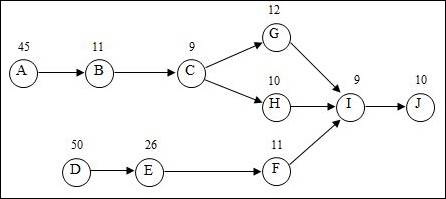
To draw: The precedence diagram.
Introduction:
Process selection:
It is the tactical choices made by a firm in picking the kind of production procedure to be followed in the process of production. The process is selected after reviewing many numbers of criteria and constraints.
Answer to Problem 7P
Precedence diagram:
Explanation of Solution
Given information:
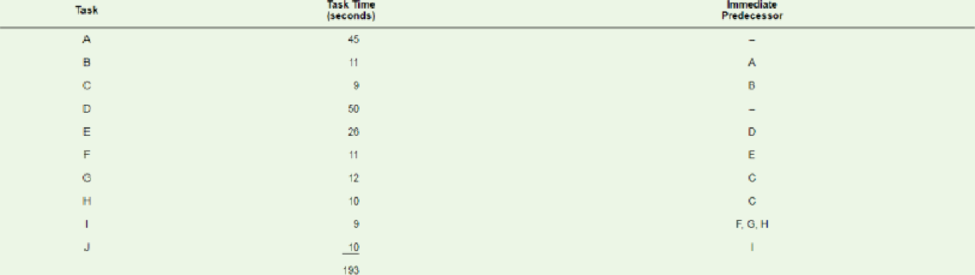
| Task | Task time (seconds) | Immediate predecessor |
| A | 45 | Nil |
| B | 11 | A |
| C | 9 | B |
| D | 50 | Nil |
| E | 26 | D |
| F | 11 | E |
| G | 12 | C |
| H | 10 | C |
| I | 9 | F, G , H |
| J | 10 | I |
| Total | 193 |
Precedence diagram:
The precedence diagram is drawn circles and arrows. The tasks are represented in circles and weights for each task are represented outside the circle. The arrows are represented to show which task is preceding the other task and so on.
b)
To determine: The minimum cycle time and the cycle time for the desired output.
Introduction:
Process selection:
It is the tactical choices made by a firm in picking the kind of production procedure to be followed in the process of production. The process is selected after reviewing many numbers of criteria and constraints.
Answer to Problem 7P
Explanation of Solution
Given information:
| Task | Task time (seconds) | Immediate predecessor |
| A | 45 | Nil |
| B | 11 | A |
| C | 9 | B |
| D | 50 | Nil |
| E | 26 | D |
| F | 11 | E |
| G | 12 | C |
| H | 10 | C |
| I | 9 | F, G , H |
| J | 10 | I |
| Total | 193 |
Operating hours per day = 7
Sum of all task times = 193 seconds
Desired output per day = 500
Calculation of minimum cycle time:
The minimum cycle time is equal to the time of the longest task.
The minimum cycle time is 50 seconds / unit.
Calculation of cycle time for the desired output:
The cycle time is calculated by dividing the operating time per day in seconds by the desired output per day.
The cycle time for the desired output is 50.4 seconds / unit.
The manager might use a cycle time of 50 seconds because it is closer to the calculated time. Also the task times are integers giving it a good chance to balance the line effectively.
c)
To determine: The minimum number of workstations for the desired output.
Introduction:
Process selection:
It is the tactical choices made by a firm in picking the kind of production procedure to be followed in the process of production. The process is selected after reviewing many numbers of criteria and constraints.
Answer to Problem 7P
Explanation of Solution
Given information:
| Task | Task time (seconds) | Immediate predecessor |
| A | 45 | Nil |
| B | 11 | A |
| C | 9 | B |
| D | 50 | Nil |
| E | 26 | D |
| F | 11 | E |
| G | 12 | C |
| H | 10 | C |
| I | 9 | F, G , H |
| J | 10 | I |
| Total | 193 |
Operating hours per day = 7
Sum of all task times = 193 seconds
Desired output per day = 500
Calculation of minimum number of workstations:
The minimum number of workstations is calculated by dividing the sum of all task times with the calculated cycle time.
The minimum number of workstations for the desired output is 4 workstations.
d)
To assign: Tasks on the basis of greatest positional weight.
Introduction:
Process selection:
It is the tactical choices made by a firm in picking the kind of production procedure to be followed in the process of production. The process is selected after reviewing many numbers of criteria and constraints.
Explanation of Solution
Given information:
| Task | Duration (minutes) | Immediate (Predecessor) |
| a | 0.1 | Nil |
| b | 0.2 | a |
| c | 0.9 | b |
| d | 0.6 | c |
| e | 0.1 | Nil |
| f | 0.2 | d, e |
| g | 0.4 | f |
| h | 0.1 | g |
| i | 0.2 | h |
| j | 0.7 | i |
| k | 0.3 | j |
| l | 0.2 | k |
Cycle time = 50 seconds
The number of following tasks, calculation of positional weight for each task is shown below.
| Task | Following tasks | Number of following tasks | Calculation of positional weight | Positional weight |
| A | B, C, G, H, I, J | 6 | 45 + 11 + 9 + 12 + 10 + 9 + 10 | 106 |
| B | C, G, H, I, J | 5 | 11 + 9 + 12 + 10 + 9 + 10 | 61 |
| C | G, H, I, J | 4 | 9 + 12 + 10 + 9 + 10 | 50 |
| D | E, F, I, J | 4 | 50 + 26 + 11 + 9 + 10 | 106 |
| E | F, I, J | 3 | 26 + 11 + 9 + 10 | 56 |
| F | I, J | 2 | 11 + 9 + 10 | 30 |
| G | I, J | 2 | 12 + 9 + 10 | 31 |
| H | I, J | 2 | 10 + 9 + 10 | 29 |
| I | J | 1 | 9 + 10 | 19 |
| J | Nil | 0 | 10 | 10 |
Assigning tasks to workstations:
| Workstation number | Eligible task | Assigned task | Task time | Unassigned cycle time | Reason |
| 50 | |||||
| 1 | A, D | A | 45 | 5 | Task 'A' has more following tasks |
| B, D | None | 5 (Idle time) | The task time is greater than the unassigned cycle time. | ||
| 50 | |||||
| 2 | B, D | D | 50 | 0 | Task 'D' has the highest positional weight |
| 50 | |||||
| 3 | B, E | B | 11 | 39 | Task 'B' has the highest positional weight |
| C, E | E | 26 | 13 | Task 'E' has the highest positional weight | |
| C, F | C | 9 | 4 | Task 'C' has the highest positional weight | |
| F, G, H | None | 4 (Idle time) | The task time is greater than the unassigned cycle time. | ||
| 50 | |||||
| 4 | F, G, H | G | 12 | 38 | Task 'G' has the highest positional weight |
| F, H | F | 11 | 27 | Task 'F' has the highest positional weight | |
| H | H | 10 | 17 | Task 'H' is the only eligible task available | |
| I | I | 9 | 8 | Task 'I' is the only eligible task available | |
| J | None | 8 (Idle time) | The task time is greater than the unassigned cycle time. | ||
| 50 | |||||
| 5 | J | J | 10 | 40 | Task 'J' is the only task remaining |
| 40 (Idle time) | All tasks completed |
Overview of tasks assignment:
| Workstation | Assigned tasks | Total cycle time used | Idle time |
| 1 | A | 45 | 5 |
| 2 | D | 50 | 0 |
| 3 | B, E, C | 46 | 4 |
| 4 | G, F, H, I | 42 | 8 |
| 5 | J | 10 | 40 |
e)
To determine: The percentage of idle time.
Introduction:
Process selection:
It is the tactical choices made by a firm in picking the kind of production procedure to be followed in the process of production. The process is selected after reviewing many numbers of criteria and constraints.
Answer to Problem 7P
Explanation of Solution
Formula to calculate percentage of idle time:
Calculation of percentage of idle time:
The percentage of idle time is 22.80%.
Want to see more full solutions like this?
Chapter 6 Solutions
EBK OPERATIONS MANAGEMENT


- Can you guys help me with this? Thank you! Here's the question: Compared to the CONSTRAINT model, how has the network changed? How do you plan to add contingency to your network? Please answer this thoroughly Here's the what-if scenario: Assume that the LA warehouse becomes temporarily or even indefinitely disabled since facing a large-scale labor disruption. Re-optimize the network considering this new constraint. Here's the scenario comparison analysis: Scenario Constraint Scenario vs What-if Scenario Summary The Constraint Scenario exhibits a higher total cost of $7,424,575.45 compared to the What-if Scenario's total cost of $6,611,905.60, signifying a difference of approximately $812,669.85, which indicates a more expensive operation in the Constraint Scenario. The average service time is slightly higher in the Constraint Scenario (0.72 days vs. 0.70 days), suggesting that the What-if Scenario provides a marginally quicker service. Moreover, the average end-to-end service time…arrow_forwardCan you guys help me with this? Thank you! Here's the question: Compared to the CONSTRAINT model, how has the network changed? How do you plan to add contingency to your network? Please answer this throughly Here's the what-if scenario: Assume that Dallas plant has lost power. It cannot serve the DCs anymore and has to remain locked indefinitely. Re-optimize the network considering this new constraint. Here's the scenario comparison analysis: Scenario Constraint Scenario vs What-if Scenario Summary In comparing the Constraint Scenario to the What-if Scenario, a few key differences highlight the efficiencies evident in the supply chain. Firstly, the total cost in the Constraint Scenario is lower at $7,424,575.45, while the What-if Scenario incurs a total cost of $7,486,369.12, resulting in a cost delta of $61,793.67. Additionally, although both scenarios exhibit the same average service time of 0.72 days, the What-if Scenario has a more favorable average end-to-end service time of 2.41…arrow_forwardEmployee In-Service Training ASSIGNMENT: In-Service Training. The intern is required to plan and implement two in-service training sessions for employees. Each in-service should last at least 10 but not more than 30 minutes and should be given to all employees affected. The preceptor or supervisor/unit manager must approve all in-service topics. 1) One presentation should be related to a policy or procedure of any kind (e.g. proper use of equipment); 2) The second presentation must be related to sanitation or safety. For each in-service presentation, the intern must develop a written class plan and a visual aid (may be a handout, poster, PowerPoint slide presentation, etc.) appropriate to the life experiences, cultural diversity and educational background of the target audience. The intern must also measure behavior change. Note, this cannot be measured by a written pre- and post- test. That would be measuring knowledge. The intern mustactually observe and document that the learners…arrow_forward
- A small furniture manufacturer produces tables and chairs. Each product must go through three stages of the manufacturing process – assembly, finishing, and inspection. Each table requires 3 hours of assembly, 2 hours of finishing, and 1 hour of inspection. The profit per table is $120 while the profit per chair is $80. Currently, each week there are 200 hours of assembly time available, 180 hours of finishing time, and 40 hours of inspection time. Linear programming is to be used to develop a production schedule. Define the variables as follows: T = number of tables produced each week C= number of chairs produced each week According to the above information, what would the objective function be? (a) Maximize T+C (b) Maximize 120T + 80C (c) Maximize 200T+200C (d) Minimize 6T+5C (e) none of the above According to the information provided in Question 17, which of the following would be a necessary constraint in the problem? (a) T+C ≤ 40 (b) T+C ≤ 200 (c) T+C ≤ 180 (d) 120T+80C ≥ 1000…arrow_forwardAs much detail as possible. Dietary Management- Nursing Home Don't add any fill-in-the-blanksarrow_forwardMenu Planning Instructions Use the following questions and points as a guide to completing this assignment. The report should be typed. Give a copy to the facility preceptor. Submit a copy in your Foodservice System Management weekly submission. 1. Are there any federal regulations and state statutes or rules with which they must comply? Ask preceptor about regulations that could prescribe a certain amount of food that must be kept on hand for emergencies, etc. Is the facility accredited by any agency such as Joint Commission? 2. Describe the kind of menu the facility uses (may include standard select menu, menu specific to station, non-select, select, room service, etc.) 3. What type of foodservice does the facility have? This could be various stations to choose from, self-serve, 4. conventional, cook-chill, assembly-serve, etc. Are there things about the facility or system that place a constraint on the menu to be served? Consider how patients/guests are served (e.g. do they serve…arrow_forward
 Practical Management ScienceOperations ManagementISBN:9781337406659Author:WINSTON, Wayne L.Publisher:Cengage,
 Purchasing and Supply Chain ManagementOperations ManagementISBN:9781285869681Author:Robert M. Monczka, Robert B. Handfield, Larry C. Giunipero, James L. PattersonPublisher:Cengage Learning
 Management, Loose-Leaf VersionManagementISBN:9781305969308Author:Richard L. DaftPublisher:South-Western College PubMarketingMarketingISBN:9780357033791Author:Pride, William MPublisher:South Western Educational Publishing