
Concept explainers
a)
To determine: The estimate of the learning rate.
Introduction: It is the rate to measure the performance of the person in the new skills and in gaining experiences.
a)
Explanation of Solution
Given information:
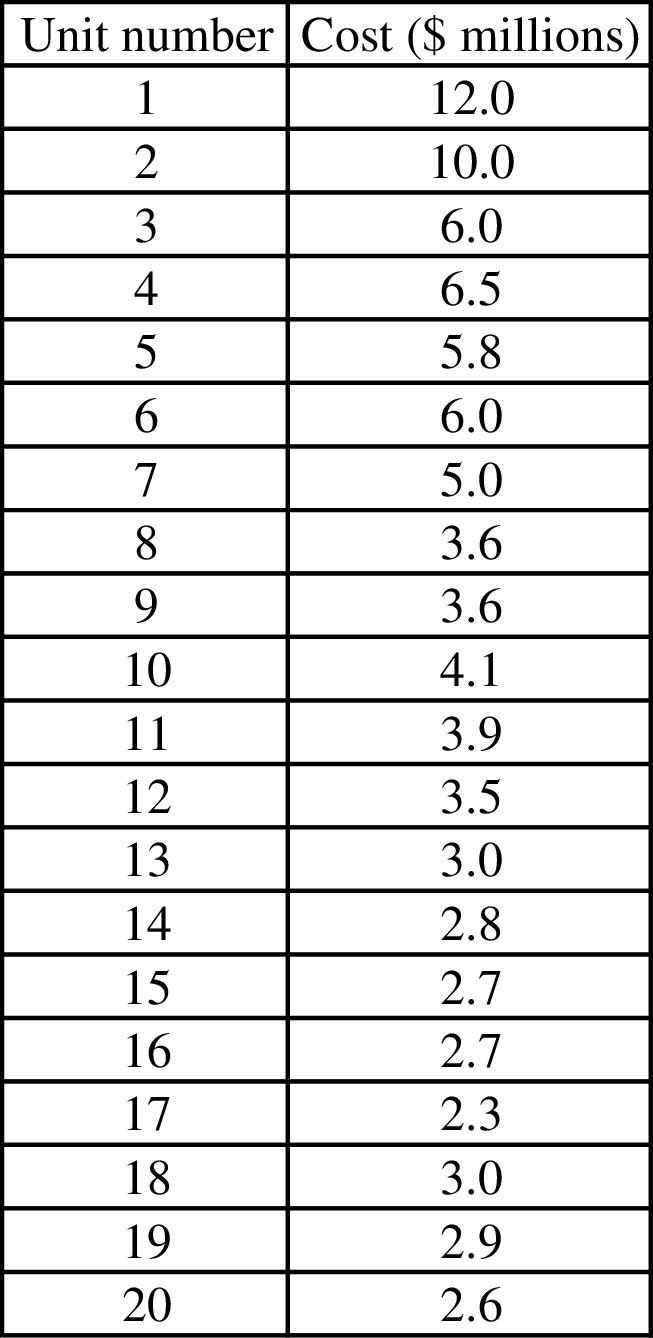
Estimate the learning rate for Unit 1 to Unit 2:
It is calculated by dividing the time taken to complete the second unit and first unit.
Hence, the learning percentage is 83.33%.
Estimate the learning rate for Unit 2 to Unit 4:
It is calculated by dividing the time taken to complete the fourth unit and second unit.
Hence, the learning percentage is 65%.
Estimate the learning rate for Unit 4 to Unit 8:
It is calculated by dividing the time taken to complete the eighth unit and fourth unit.
Hence, the learning percentage is 55.38%.
Estimate the learning rate for Unit 8 to Unit 16:
It is calculated by dividing the time taken to complete the eighth unit and fourth unit.
Hence, the learning percentage is 75%.
Determine the average learning rate:
Hence, the average learning rate is 70%.
b)
To determine: The bid that Company L should submit for the total order of 100 units.
Introduction: It is the rate to measure the performance of the person in the new skills and in gaining experiences.
b)
Explanation of Solution
Given information:

Determine the average learning rate:
Hence, the average learning rate is 70%.
Determine the bid that Company L should submit for the total order of 100 units:
It is computed by subtracting the cumulative value for 20 units from cumulative value for 120 units and multiplying it with the cost to produce the first unit.
The cumulative values can be determined using the table of cumulative values. For example, 19.570 is the cumulative value for 120 units and 70% learning rate.
Hence, the bid that Company L should submit for the total order of 100 units is $145,956,000.
c)
To determine: The expected cost for the last unit under the learning rate.
Introduction: It is the rate to measure the performance of the person in the new skills and in gaining experiences.
c)
Explanation of Solution
Given information:

Determine the average learning rate:
Hence, the average learning rate is 70%.
Determine the expected cost for the last unit under the learning rate:
It is computed by multiplying the cumulative value for 120 units with the cost to produce one unit.
The cumulative values can be determined using the table of cumulative values. For example, .0062 is the cumulative value for 120 units and 70% learning rate.
Hence, the expected cost to produce 120th units is $1,021,200.
Want to see more full solutions like this?
Chapter 6 Solutions
OPERATIONS+SUPPLY CHAIN...:CORE >INTL<


- Major League Baseball's World Series is a maximum of seven games, with the winner being the first team to win four games. Assume that the Atlanta Braves and the Minnesota Twins are playing in the World Series and that the first two games are to be played in Atlanta, the next three games at the Twins' ballpark, and the last two games, if necessary, back in Atlanta. Taking into account the projected starting pitchers for each game and the home field advantage, suppose the probabilities of Atlanta winning each game are as follows. Game 1 2 3 4 5 6 7 Probability of Win 0.61 0.56 0.47 0.44 0.47 0.54 0.49 Construct a simulation model in which whether Atlanta wins or loses each game is a random variable. Use the model to answer the following questions. (Use at least 1,000 trials.) (a) What is the average number of games played regardless of winner? (Round your answer to one decimal place.) games (b) What is the probability that the Atlanta Braves win the World Series? (Round your answer to…arrow_forwardModel File Available: Download NBAGIMS.xlsx The Iowa Wolves are scheduled to play against the Maine Red Claws in an upcoming game in the National Basketball Association (NBA) G League. Because a player in the NBA G League is still developing his skills, the number of points he scores in a game can vary substantially. Develop a spreadsheet model that simulates the points scored by each team. Assume that each player's point production can be represented as an integer uniform variable with the ranges provided in the following table. (Use at least 1,000 trials.) Player Iowa Wolves Maine Red Claws 1 [5, 20] [6, 12] 2 [7, 20] [15, 20] 3 [5, 10] [10, 20] 4 [10, 40] [15, 30] 5 [7, 20] [6, 10] 6 [2, 10] [1, 20] 7 [2, 5] [1, 4] 8 [2,4] [2,4] (a) Consider the points scored by the Iowa Wolves team. (Round your answers to two decimal places.) What is the average of points scored? What is the standard deviation? What is the shape of the distribution? O uniform bell-shaped skewed left skewed rightarrow_forwardThe wedding date for a couple is quickly approaching, and the wedding planner must provide the caterer an estimate of how many people will attend the reception so that the appropriate quantity of food is prepared for the buffet. The following table contains information on the number of RSVP guests for the 145 invitations. Unfortunately, the number of guests does not always correspond to the number of RSVPed guests. Based on her experience, the wedding planner knows it is extremely rare for guests to attend a wedding if they notified that they will not be attending. Therefore, the wedding planner will assume that no one from these 50 invitations will attend. The wedding planner estimates that the each of the 25 guests planning to come solo has a 74% chance of attending alone, a 20% chance of not attending, and a 6% chance of bringing a companion. For each of the 60 RSVPs who plan to bring a companion, there is a 90% chance that they will attend with a companion, a 4% chance of attending…arrow_forward
- How do we prioritize mental well-being and incorporate stress management techniques? What are the obstacles to a balanced Workout plan to ensure comprehensive fitness and how to overcome them?arrow_forwardYou ordered 1,000 tons of cocoa beans, which will be delivered to your chocolate manufacturing plant in PA in March next year. The current price of cocoa beans, as of today, is $2,260 per ton. There is an investor company who currently offers two types of risk hedging contracts: -Forward contract: $2,400 per ton at a fixed cost of $30,000. -Futures contract: $2,400 per ton at a cost of $50 per ton (therefore, the up-front cost is 1000 tons * $50 per ton = $50,000) Assume that the price of cocoa beans went down to $2,200 per ton in March 2023. How much would you need to pay for 1,000 tons of cocoa beans under the futures contract?arrow_forwardWhat are the goals for maintaining focus, tracking progress, and staying motivated on wellness? How do they relate and impact the past and future routine workouts? What are the strengths and weaknesses, and how can we overcome the obstacles that could occur?arrow_forward
- What do you think is more effective in the long run, bringing in more staff during peak times or investing in cross-training and process redesign to manage demand variability better? With a Referencearrow_forward5. Glenn Dental Clinic provides general dental care to residents of Philadelphia on a walk-in basis. The clinic has started receiving complaints from patients that the waiting time is too long and has asked you to investigate whether this problem can be solved. Upon arrival, customers first receive a series of paperwork from the receptionist and fill out relevant information such as personal health records and insurance provider. The form is then handed back to the receptionist who enters the information into the computer system for the dentist to see. A dental assistant then takes an X-ray from the patient. A dentist then performs the checkup and discusses any issues with the patient. Based on conversations with staff members at the clinic, you have obtained the following information on the process: a. It takes about 5 minutes for a customer to fill out the paperwork. b. Entry of information on the paperwork into the system and verification with past records takes another 5 minutes…arrow_forwardWhy should businesses not set efficiency as the only goal? • Note: Include a reference with supportive citations in the discussion reply in your post.arrow_forward
- Do you think there are other methods to achieve efficiency, such as specialization or using technology to alleviate the bottleneck, like patient wait time?arrow_forwardIs it hard to improve efficiency in a process? Why or why not? Give an example of how to improve the efficiency of a process. Please provide a reference in APA formarrow_forwardSimplex Method Three types of paints are manufactured in one machine; Interior paint, Exterior paint and Paint for metal structures. The preparation time for each type of paint is 2, 3 and 4 minutes respectively and the processing time is 3, 2 and 1 minute. The profit contributed by each product is 12, 10 and 15 dollars respectively. The machine availability is 100 minutes and 200 minutes for machine setup. 1. Determine the optimum number of types of paints to be manufactured. 2. Determine the optimal utility value.arrow_forward
 Practical Management ScienceOperations ManagementISBN:9781337406659Author:WINSTON, Wayne L.Publisher:Cengage,
 Operations ManagementOperations ManagementISBN:9781259667473Author:William J StevensonPublisher:McGraw-Hill Education
 Operations and Supply Chain Management (Mcgraw-hi...Operations ManagementISBN:9781259666100Author:F. Robert Jacobs, Richard B ChasePublisher:McGraw-Hill Education
 Purchasing and Supply Chain ManagementOperations ManagementISBN:9781285869681Author:Robert M. Monczka, Robert B. Handfield, Larry C. Giunipero, James L. PattersonPublisher:Cengage Learning
 Production and Operations Analysis, Seventh Editi...Operations ManagementISBN:9781478623069Author:Steven Nahmias, Tava Lennon OlsenPublisher:Waveland Press, Inc.