
Videos
Throughout the picturesque valleys of mid-18th-century Germany echoed the song of the Neuländer (newlander), enticing journeymen who struggled to feed their families with the dream and promise of colonial America. The typical Neuländer sought to sign up several families from a village for immigration to a particular colony. By registering a group of neighbors, rather than isolated families, the agent increased the likelihood that his signees would not stray to the proposals of a competitor. Additionally, by signing large groups, the Neuländer fattened his purse, to the tune of one to two florins a head.
Generally, the Germans who chose to undertake the hardship of a trans-Atlantic voyage were poor, yet the cost of such a voyage was high. Records from a 1753 voyage indicate that the cost of an adult fare (one freight) from Rotterdam to Boston was 7.5 pistoles. Children aged 4 to 13 were assessed at half the adult rate (one-half freight) and those under 4 were not charged. To get a sense of the expense involved, an adult fare is equivalent to approximately $2000! Many immigrants did not have the necessary funds to purchase passage and, determined to make the crossing, paid with years of indentured servitude.
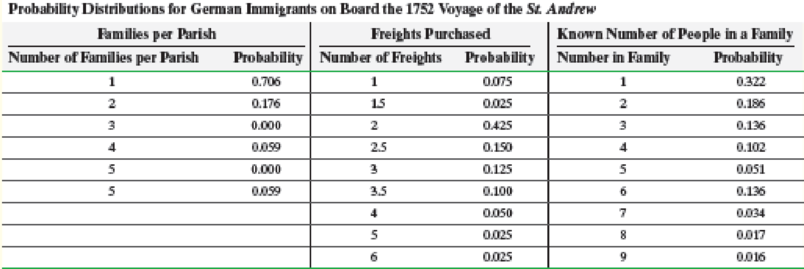
As a historian studying the influence of these German immigrants on colonial America, Hans Langenscheidt is interested in describing various demographic characteristics of these people. Unfortunately, accurate records are rare. He has discovered a partially reconstructed 1752 passenger list for a ship, the St. Andrew, containing the names of the heads of families, a list of family members traveling, their parish of origin, and the number of freights each family purchased. Unfortunately, some data are missing for some families. Langenscheidt believes that the demographic parameters of this passenger list are likely to be similar to those of the other voyages taken from Germany to America during the mid-18th century. Assuming that he is correct, he believes that it is appropriate to create a discrete
6. Summarize your findings in a report. Discuss any assumptions made throughout this analysis. What are the consequences to your calculations and conclusions if your assumptions are subsequently determined to be invalid?
Want to see the full answer?
Check out a sample textbook solution
Chapter 6 Solutions
Fundamentals of Statistics (5th Edition)


- The Conch Café, located in Gulf Shores, Alabama, features casual lunches with a great view of the Gulf of Mexico. To accommodate the increase in business during the summer vacation season, Fuzzy Conch, the owner, hires a large number of servers as seasonal help. When he interviews a prospective server, he would like to provide data on the amount a server can earn in tips. He believes that the amount of the bill and the number of diners are both related to the amount of the tip. He gathered the following sample information. Customer Amount of Tip Amount of Bill Number of Diners Customer Amount of Tip Amount of Bill Number of Diners 1 $ 7.00 $ 48.97 5 16 $ 3.30 $ 23.59 2 2 4.50 28.23 4 17 3.50 22.30 2 3 1.00 10.65 1 18 3.25 32.00 2 4 2.40 19.82 3 19 5.40 50.02 4 5 5.00 28.62 3 20 2.25 17.60 3 6 4.25 24.83 2 21 5.50 44.47 4 7 0.50 6.24 1 22 3.00 20.27 2…arrow_forwardThe Conch Café, located in Gulf Shores, Alabama, features casual lunches with a great view of the Gulf of Mexico. To accommodate the increase in business during the summer vacation season, Fuzzy Conch, the owner, hires a large number of servers as seasonal help. When he interviews a prospective server, he would like to provide data on the amount a server can earn in tips. He believes that the amount of the bill and the number of diners are both related to the amount of the tip. He gathered the following sample information. Customer Amount of Tip Amount of Bill Number of Diners Customer Amount of Tip Amount of Bill Number of Diners 1 $ 6.05 $ 73.22 1 16 $ 3.30 $ 23.59 2 2 4.50 28.23 4 17 3.50 22.30 2 3 1.00 10.65 1 18 3.25 32.00 2 4 2.40 19.82 3 19 5.40 50.02 4 5 5.00 28.62 3 20 2.25 17.60 3 6 4.25 24.83 2 21 1.40 41.80 5 7 .50 6.25 1 22 3.00 20.27 2…arrow_forwardFrom 1840 to 1850, more than 12,000 pioneers migrated west in wagon trains. It was typically about a 2,000-mile journey, and pioneers averaged about 10 miles per day. One pioneer family, the Smiths, is planning to join a wagon train traveling west to Oregon. The destination is Fort Vancouver, which is near present-day Portland. The family plans to join a wagon train in St. Louis. However, the trains follow various trails west that are mostly determined by the location of forts and trading posts along the way. The Smith family wants to choose a wagon train that will get them to Oregon in the shortest amount of time. They have checked around with the different wagon train leaders plus immigrants, soldiers, fur traders, and scouts who have previously made the trip west, and from the information they have gathered, they have developed the following network, with estimated times (in days) along each branch: a. Determine the shortest route for the Smiths from St. Louis to Ft. Vancouver. b.…arrow_forward
- Kentville, a community of 10,000 people, resides next to a krypton mine, and there is a concern that the emission from the krypton smelter have resulted in adverse effects. Specifically, Kryptonosis seems to have killed 12 of Kentville’s inhabitants last year. A neighboring community, Lanesburg, has 25,000 inhabitants and is far enough from the smelter to not be affected by the emission. In Lanesburg, only three people last year died of Kryptonosis. Given that the number of deaths in Kentville and their causes last year were: Heart attack=7 Accidents=4 Kryptonosis=12 Other=6 What is the risk of dying of Kryptonosis in Kentville relative to non-contaminated locality?What is the risk of dying of Kryptonosis in Kentville relative to deaths due to other causes? How many times the chance of dying of Kryptonosis compared to dying of accidents ? How many times the chance of dying of Kryptonosis compared to Other causes?arrow_forwardSeveral months ago while shopping, I was interviewed to see whether or not I'd be interested in signing up for a subscription to a yoga app. I fall into the category of people who have a membership at a local gym, and guessed that, like me, many people in that category would not be interested in the app. My friend Keiko falls in the category of people who do not have a membership at a local gym, and I was thinking that she might like a subscription to the app. After being interviewed, I looked at the interviewer's results. Of the 81 people in my market category who had been interviewed, 12 said they would buy a subscription, and of the 118 people in Keiko's market category, 36 said they would buy a subscription. Assuming that these data came from independent, random samples, can we conclude, at the 0.01 level of significance, that the proportion p, of all mall shoppers in my market category who would buy a subscription is less than the proportion p, of all mall shoppers in Keiko's…arrow_forwardDr. Barton hypothesizes that if 1st grade students are assigned to practice sight word flashcards for 10 minutes every day for their first semester, they will end up reading more books in their second semester. She creates two groups of 25 students each and gives each group the same sight word flashcards. Group A is assigned to practice with the flashcards for 10 minutes every day for their first semester. Group B is not given this assignment. Each group is tasked with keeping a reading log during their second semester. At the end of 1st grade, Dr. Barton counts how many books each group has read. Group A read 68 books, and Group B read 92 books. The control group is: The independent variable is: The dependent variable is: This study shows that there is a positive correlation between 10 minutes of daily flashcard practice of sight words and the amount of books read. T/F This study is an example of descriptive research. T/Farrow_forward
- Several months ago while shopping, I was interviewed to see whether or not I'd be interested in signing up for a subscription to a yoga app. I fall into the category of people who have a membership at a local gym, and guessed that, like me, many people in that category would not be interested in the app. My friend Keisha falls in the category of people who do not have a membership at a local gym, and I was thinking that she might like a subscription to the app. After being interviewed, I looked at the interviewer's results. Of the 97 people in my market category who had been interviewed, 14 said they would buy a subscription, and of the 95 people in Keisha's market category, 30 said they would buy a subscription. Assuming that these data came from independent, random samples, can we conclude, at the 0.05 level of significance, that the proportion p, of all mall shoppers in my market category who would buy a subscription is less than the proportion p, of all mall shoppers in Keisha's…arrow_forwardA friend who lives in Los Angeles makes frequent consultingtrips to Washington, D.C.; 50% of the time shetravels on airline #1, 30% of the time on airline #2, and the remaining 20% of the time on airline #3. For airline#1, flights are late into D.C. 30% of the time and late intoL.A. 10% of the time. For airline #2, these percentagesare 25% and 20%, whereas for airline #3 the percentagesare 40% and 25%. If we learn that on a particular trip shearrived late at exactly one of the two destinations, whatare the posterior probabilities of having flown on airlines#1, #2, and #3? Assume that the chance of a late arrival inL.A. is unaffected by what happens on the flight to D.C.[Hint: From the tip of each first-generation branch on atree diagram, draw three second-generation brancheslabeled, respectively, 0 late, 1 late, and 2 late.]arrow_forwardA marketing report concerning personal computers states that 650,000 owners will buy a printer for their machines next year and 1,250,000 will buy at least one software package. If the report states that 1,450,000 owners will buy either a printer or at least one software package, how many will buy both a printer and at least one software package?arrow_forward
- Dr. Loras Tyrell was curious to see if his students actually saved money by purchasing books from sources other than the college bookstore. He administered a survey to all his students asking how they obtained their book (Bookstore, Rented, ebook, or on the web – WebBooks) and how much they paid for the book. He obtained the information below. If the values for web-books are normally distributed, we know that of the students who purchased their book on the web (WebBooks), about 68.3% of those students paid approximately $----- to ----?arrow_forwardIs a basketball player's ability to make free throws different when they get their own rebound or when someone else gets their rebound for them? This is what student researchers wanted to explore. The researchers used students (20 females and 20 males) taking a college physical education class as their subjects. The students each attempted 10 shots from the free throw line where they had to get their own rebound and 10 shots where someone else got their rebound and passed the ball back to them while they stayed on the free throw line. They randomly determined the order that they took these shots, with some getting their own rebounds first and some having someone else get the rebounds first. Here are the hypotheses in the picture:arrow_forwardSeveral months ago while shopping, I was interviewed to see whether or not I'd be interested in signing up for a subscription to a yoga app. I fall into the category of people who have a membership at a local gym, and guessed that, like me, many people in that category would not be interested in the app. My friend Mary falls in the category of people who do not have a membership at a local gym, and I was thinking that she might like a subscription to the app. After being interviewed, I looked at the interviewer's results. Of the 95 people in my market category who had been interviewed, 14 said they would buy a subscription, and of the 102 people in Mary's market category, 32 said they would buy a subscription. Assuming that these data came from independent, random samples, can we conclude, at the 0.01 level of significance, that the proportion P₁ of all mall shoppers in my market category who would buy a subscription is less than the proportion P2 of all mall shoppers in Mary's market…arrow_forward
 MATLAB: An Introduction with ApplicationsStatisticsISBN:9781119256830Author:Amos GilatPublisher:John Wiley & Sons Inc
 Probability and Statistics for Engineering and th...StatisticsISBN:9781305251809Author:Jay L. DevorePublisher:Cengage Learning
 Statistics for The Behavioral Sciences (MindTap C...StatisticsISBN:9781305504912Author:Frederick J Gravetter, Larry B. WallnauPublisher:Cengage Learning
 Elementary Statistics: Picturing the World (7th E...StatisticsISBN:9780134683416Author:Ron Larson, Betsy FarberPublisher:PEARSON
 The Basic Practice of StatisticsStatisticsISBN:9781319042578Author:David S. Moore, William I. Notz, Michael A. FlignerPublisher:W. H. Freeman
 Introduction to the Practice of StatisticsStatisticsISBN:9781319013387Author:David S. Moore, George P. McCabe, Bruce A. CraigPublisher:W. H. Freeman