Concept explainers
Videos
a.
Find the percentage of the students who have done their homework and attended lectures will obtain a grade of A on this multiple-choice examination.
a.
Answer to Problem 49SE
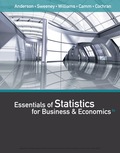
The percentage of the students who have done their homework and attended lectures will obtain a grade of A on this multiple-choice examination is about 5.113%.
Explanation of Solution
Calculation:
The examination contains 50 multiple choice questions. Each question has four options. The students have 75%
Here, the student must answer correctly to 43 questions to obtain grade A.
The formula for mean in binomial distribution is,
The value of mean is,
The formula for standard deviation is,
The value of standard deviation is,
Continuity correction:
The binomial probability is converted to a
If the binomial probability represents “more than c” then the normal probability is
By using continuity correction, the value 0.5 is subtracted from 43.
That is,
Thus, the binomial probability to a normal probability by using continuity correction is
Software Procedure:
Step-by-step procedure to obtain the probability value using the MINITAB software:
- Choose Graph > Probability Distribution Plot choose View Probability > OK.
- Enter the Mean as 37.5 and Standard deviation as 3.06.
- From Distribution, choose ‘Normal’ distribution.
- Click the Shaded Area tab.
- Choose X Value and Right Tail for the region of the curve to shade.
- Enter the X value as 42.5.
- Click OK.
Output using the MINITAB software is given below:
From the graph, the probability value is 0.05113.
Thus, the percentage of the students is 5.113%.
b.
Find the percentage of the students who have done their homework and attended lectures will obtain a grade of C on this multiple-choice examination.
b.
Answer to Problem 49SE
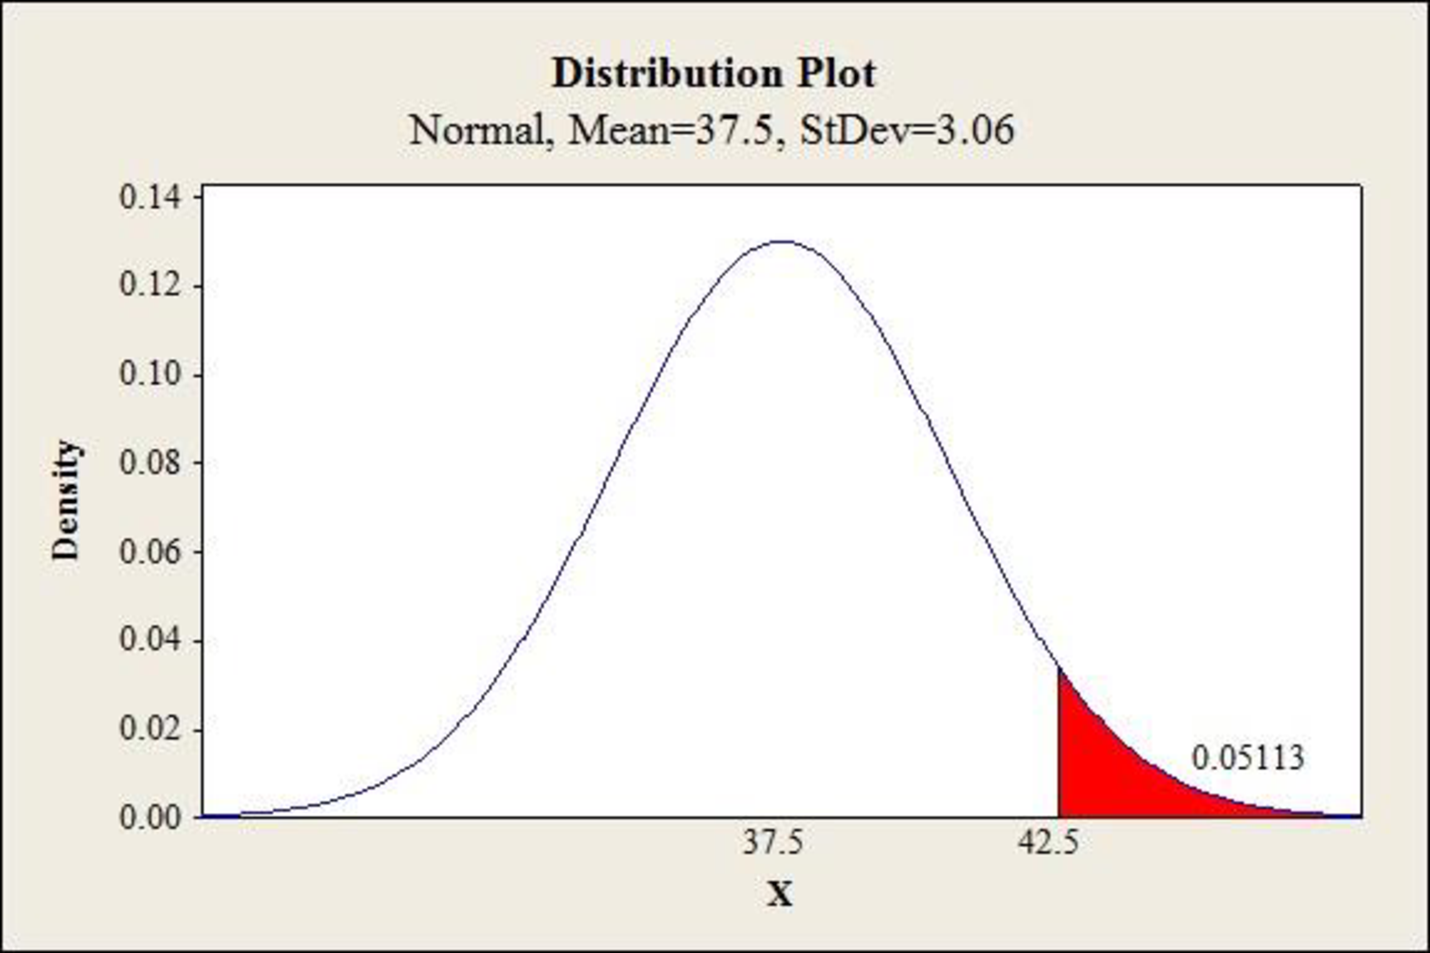
The percentage of the students who have done their homework and attended lectures will obtain a grade of C on this multiple-choice examination is 57.99%.
Explanation of Solution
Calculation:
Here, the student must answer correctly to 35 to 39 questions to obtain grade C.
If the binomial probability represents “between than
By using continuity correction, the value 0.5 is subtracted from 35 and the value 0.5 added to 39.
That is,
Thus, the binomial probability to a normal probability by using continuity correction is
Software Procedure:
Step-by-step procedure to obtain the probability value using the MINITAB software:
- Choose Graph > Probability Distribution Plot choose View Probability > OK.
- Enter the Mean as 37.5 and Standard deviation as 3.06.
- From Distribution, choose ‘Normal’ distribution.
- Click the Shaded Area tab.
- Choose X Value and Middle Tail for the region of the curve to shade.
- Enter the X value 1 as 34.5 and X value 2 as 39.5.
- Click OK.
Output using the MINITAB software is given below:
From the graph, the probability value is 0.5799
Thus, the percentage of the students is 57.99%.
c.
Find the percentage of the students who have done their homework and attended lectures will pass the examination.
c.
Answer to Problem 49SE
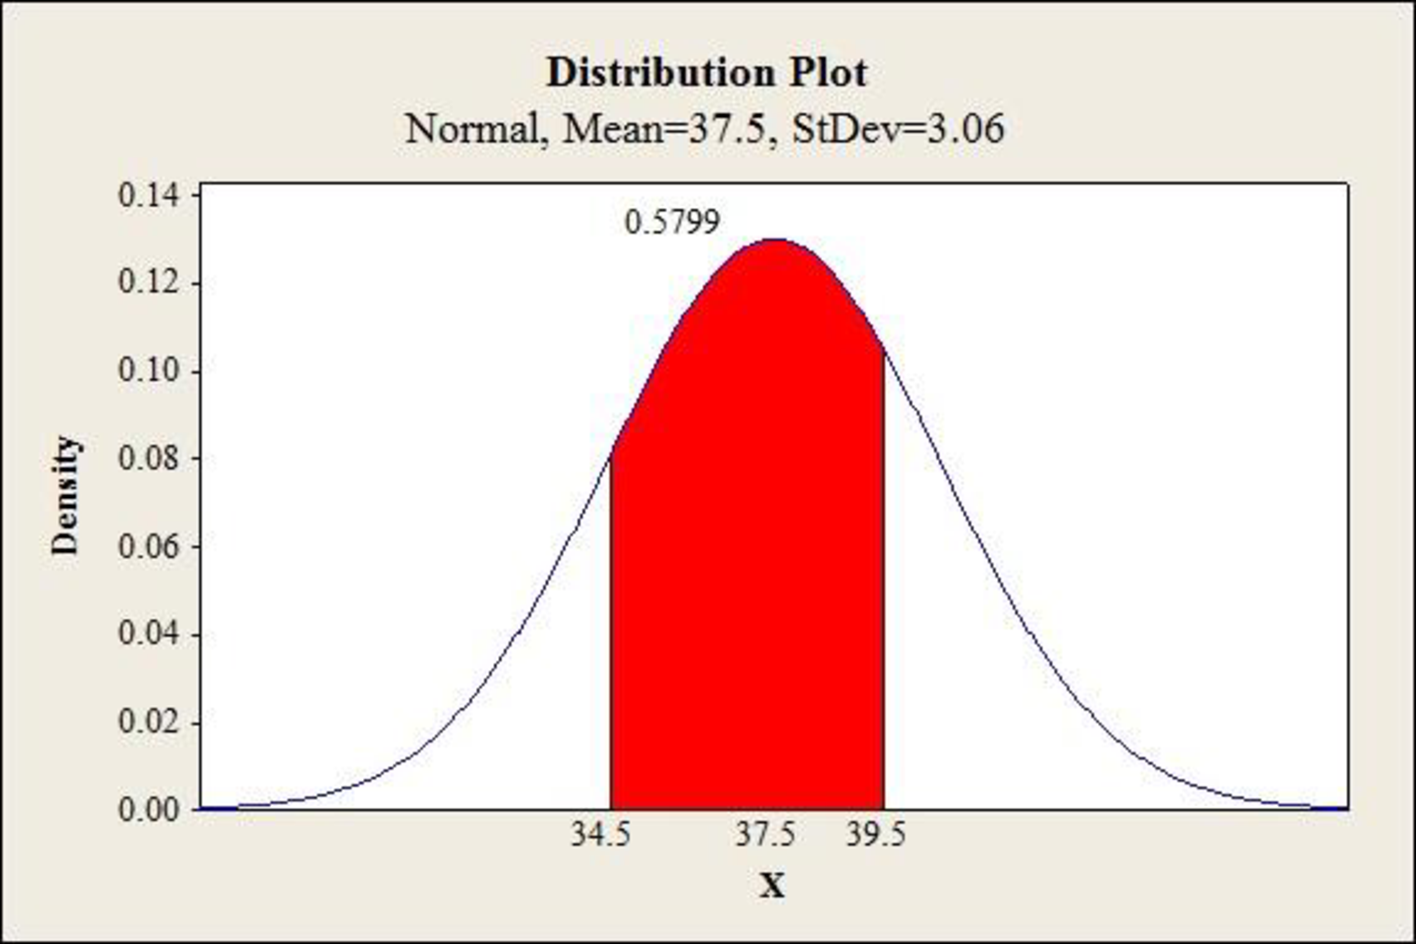
The percentage of the students who have done their homework and attended lectures will pass the examination is about 99.55%.
Explanation of Solution
Calculation:
Here, the student must answer correctly to 30 or more questions to pass the examination.
If the binomial probability represents “more than c” then the normal probability is
By using continuity correction, the value 0.5 is subtracted from 30.
That is,
Thus, the binomial probability to a normal probability by using continuity correction is
Software Procedure:
Step-by-step procedure to obtain the probability value using the MINITAB software:
- Choose Graph > Probability Distribution Plot choose View Probability > OK.
- Enter the Mean as 37.5 and Standard deviation as 3.06.
- From Distribution, choose ‘Normal’ distribution.
- Click the Shaded Area tab.
- Choose X Value and Right Tail for the region of the curve to shade.
- Enter the X value as 29.5.
- Click OK.
Output using the MINITAB software is given below:
From the graph, the probability value is 0.9955.
Thus, the percentage of the students is 99.55%.
d.
Find the probability that the students who did not attend the classes and not done the homework will answer 30 or more questions correctly on the multiple choice examinations.
d.
Answer to Problem 49SE
The students who did not attend the classes and not done the homework will not pass the examination by guess.
Explanation of Solution
Calculation:
Here, the student did not attend the class and has not done the homework.
Approximately 25% students of did not attend the classes and not done the homework.
The value of mean is,
The value of standard deviation is,
If the binomial probability represents “more than c” then the normal probability is
By using continuity correction, the value 0.5 is subtracted from 30.
That is,
Thus, the binomial probability to a normal probability by using continuity correction is
Software Procedure:
Step-by-step procedure to obtain the probability value using the MINITAB software:
- Choose Graph > Probability Distribution Plot choose View Probability > OK.
- Enter the Mean as 12.5 and Standard deviation as 3.06.
- From Distribution, choose ‘Normal’ distribution.
- Click the Shaded Area tab.
- Choose X Value and Right Tail for the region of the curve to shade.
- Enter the X value as 29.5.
- Click OK.
Output using the MINITAB software is given below:
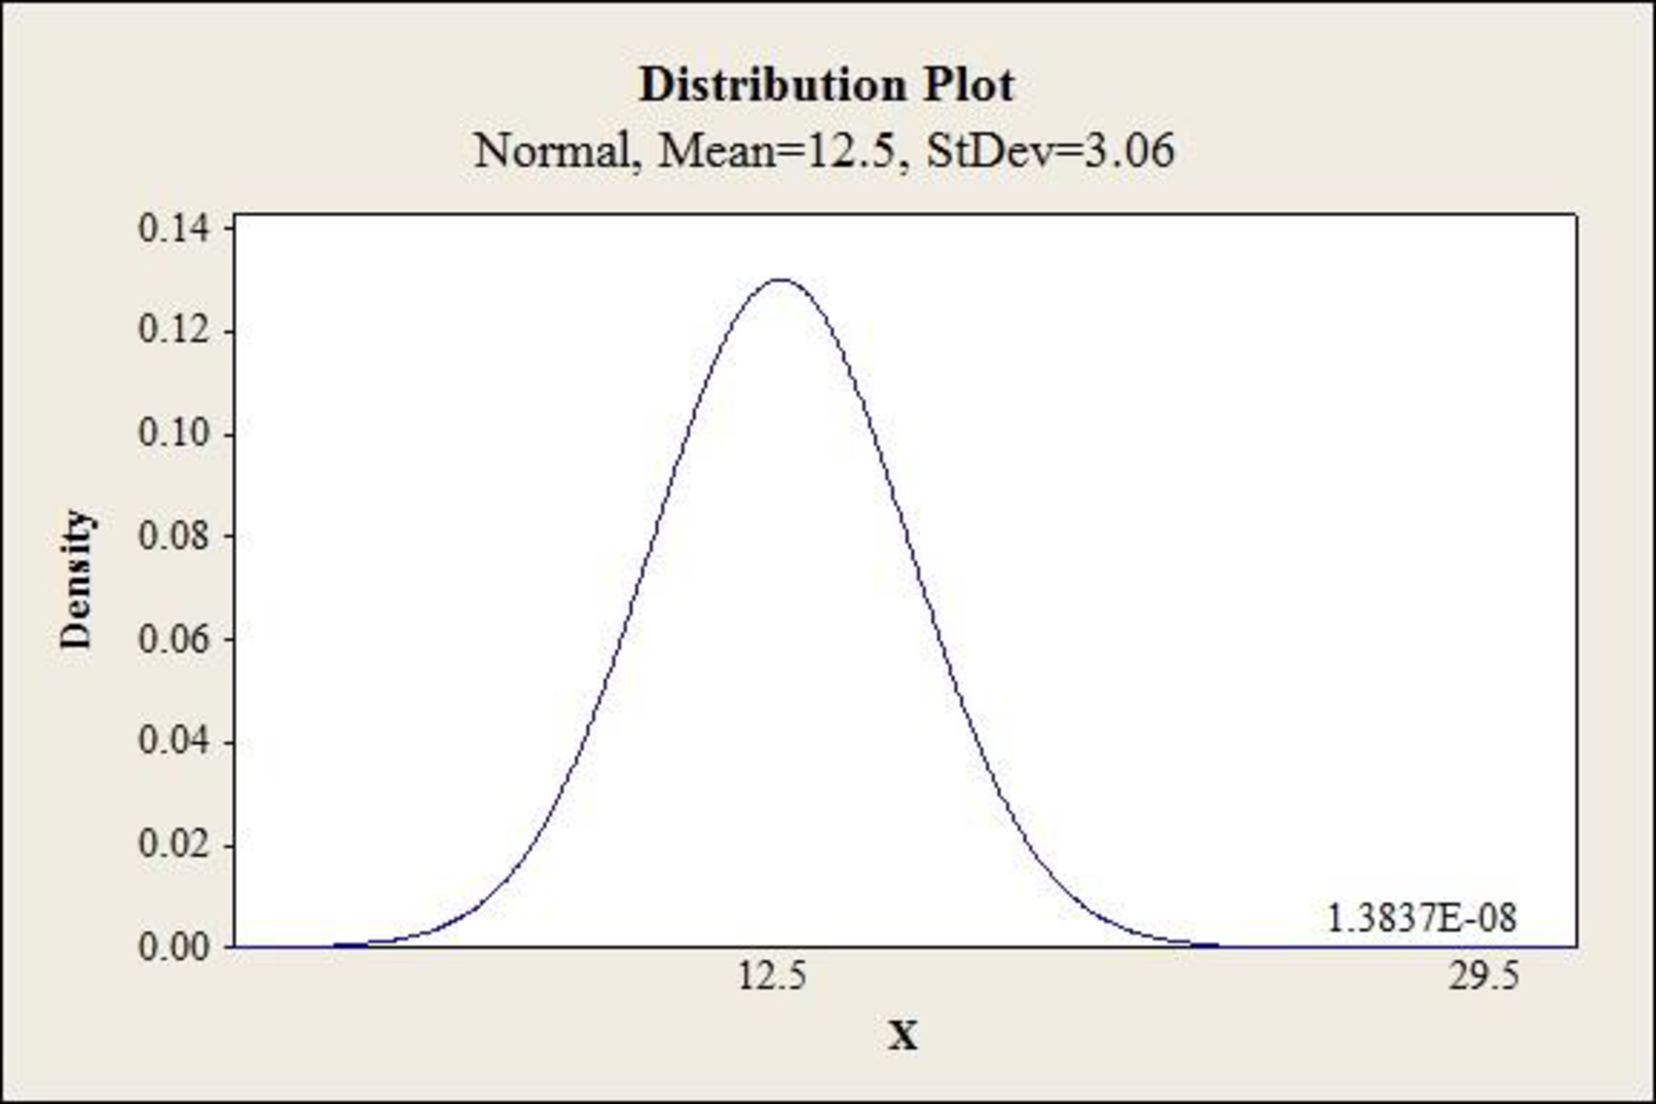
From the graph, the probability value is 0.000. Thus, the percentage of the students is 0.
Want to see more full solutions like this?
Chapter 6 Solutions
EBK ESSENTIALS OF STATISTICS FOR BUSINE


- A survey of 581 citizens found that 313 of them favor a new bill introduced by the city. We want to find a 95% confidence interval for the true proportion of the population who favor the bill. What is the lower limit of the interval? Enter the result as a decimal rounded to 3 decimal digits. Your Answer:arrow_forwardA survey of 581 citizens found that 313 of them favor a new bill introduced by the city. We want to find a 95% confidence interval for the true proportion of the population who favor the bill. What is the lower limit of the interval? Enter the result as a decimal rounded to 3 decimal digits. Your Answer:arrow_forward2. The SMSA data consisting of 141 observations on 10 variables is fitted by the model below: 1 y = Bo+B1x4 + ẞ2x6 + ẞ3x8 + √1X4X8 + V2X6X8 + €. See Question 2, Tutorial 3 for the meaning of the variables in the above model. The following results are obtained: Estimate Std. Error t value Pr(>|t|) (Intercept) 1.302e+03 4.320e+02 3.015 0.00307 x4 x6 x8 x4:x8 x6:x8 -1.442e+02 2.056e+01 -7.013 1.02e-10 6.340e-01 6.099e+00 0.104 0.91737 -9.455e-02 5.802e-02 -1.630 0.10550 2.882e-02 2.589e-03 11.132 1.673e-03 7.215e-04 2.319 F) x4 1 3486722 3486722 17.9286 4.214e-05 x6 1 14595537 x8 x4:x8 x6:x8 1 132.4836 < 2.2e-16 1045693 194478 5.3769 0.02191 1 1198603043 1198603043 6163.1900 < 2.2e-16 1 25765100 25765100 1045693 Residuals 135 26254490 Estimated variance matrix (Intercept) x4 x6 x8 x4:x8 x6:x8 (Intercept) x4 x6 x8 x4:x8 x6:x8 0.18875694 1.866030e+05 -5.931735e+03 -2.322825e+03 -16.25142055 0.57188953 -5.931735e+03 4.228816e+02 3.160915e+01 0.61621781 -0.03608028 -0.00445013 -2.322825e+03…arrow_forward
- In some applications the distribution of a discrete RV, X resembles the Poisson distribution except that 0 is not a possible value of X. Consider such a RV with PMF where 1 > 0 is a parameter, and c is a constant. (a) Find the expression of c in terms of 1. (b) Find E(X). (Hint: You can use the fact that, if Y ~ Poisson(1), the E(Y) = 1.)arrow_forwardSuppose that X ~Bin(n,p). Show that E[(1 - p)] = (1-p²)".arrow_forwardI need help with this problem and an explanation of the solution for the image described below. (Statistics: Engineering Probabilities)arrow_forward
- I need help with this problem and an explanation of the solution for the image described below. (Statistics: Engineering Probabilities)arrow_forwardThis exercise is based on the following data on four bodybuilding supplements. (Figures shown correspond to a single serving.) Creatine(grams) L-Glutamine(grams) BCAAs(grams) Cost($) Xtend(SciVation) 0 2.5 7 1.00 Gainz(MP Hardcore) 2 3 6 1.10 Strongevity(Bill Phillips) 2.5 1 0 1.20 Muscle Physique(EAS) 2 2 0 1.00 Your personal trainer suggests that you supplement with at least 10 grams of creatine, 39 grams of L-glutamine, and 90 grams of BCAAs each week. You are thinking of combining Xtend and Gainz to provide you with the required nutrients. How many servings of each should you combine to obtain a week's supply that meets your trainer's specifications at the least cost? (If an answer does not exist, enter DNE.) servings of xtend servings of gainzarrow_forwardI need help with this problem and an explanation of the solution for the image described below. (Statistics: Engineering Probabilities)arrow_forward
- I need help with this problem and an explanation of the solution for the image described below. (Statistics: Engineering Probabilities)arrow_forwardDATA TABLE VALUES Meal Price ($) 22.78 31.90 33.89 22.77 18.04 23.29 35.28 42.38 36.88 38.55 41.68 25.73 34.19 31.75 25.24 26.32 19.57 36.57 32.97 36.83 30.17 37.29 25.37 24.71 28.79 32.83 43.00 35.23 34.76 33.06 27.73 31.89 38.47 39.42 40.72 43.92 36.51 45.25 33.51 29.17 30.54 26.74 37.93arrow_forwardI need help with this problem and an explanation of the solution for the image described below. (Statistics: Engineering Probabilities)arrow_forward
 Holt Mcdougal Larson Pre-algebra: Student Edition...AlgebraISBN:9780547587776Author:HOLT MCDOUGALPublisher:HOLT MCDOUGAL
 Algebra & Trigonometry with Analytic GeometryAlgebraISBN:9781133382119Author:SwokowskiPublisher:Cengage
 College Algebra (MindTap Course List)AlgebraISBN:9781305652231Author:R. David Gustafson, Jeff HughesPublisher:Cengage Learning
 Glencoe Algebra 1, Student Edition, 9780079039897...AlgebraISBN:9780079039897Author:CarterPublisher:McGraw Hill
 Big Ideas Math A Bridge To Success Algebra 1: Stu...AlgebraISBN:9781680331141Author:HOUGHTON MIFFLIN HARCOURTPublisher:Houghton Mifflin Harcourt