
Intro Stats, Books a la carte Plus NEW MyLab Statistics with Pearson eText -- Access Card Package (5th Edition)
5th Edition
ISBN: 9780134210247
Author: Richard D. De Veaux, Paul Velleman, David E. Bock
Publisher: PEARSON
expand_more
expand_more
format_list_bulleted
Concept explainers
Videos
Textbook Question
Chapter 6, Problem 44E
Burgers again In the previous exercise you analyzed the association between the amounts of fat and sodium in fast food hamburgers. What about fat and calories? Here are data for the same burgers:
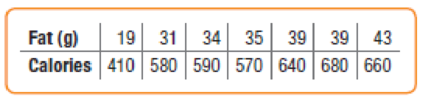
Analyze the association between fat content and calories using
Expert Solution & Answer
Want to see the full answer?
Check out a sample textbook solution
Students have asked these similar questions
Apply STATA commands & submit the output for each question
only when indicated below
i. Apply the command egen to create a variable called "wyd"
which is the rowtotal function on variables bwght & faminc.
ii. Apply the list command for the first 10 observations to
show that the code in part i worked. Include the outcome of
this code
iii. Apply the egen command to create a new variable called
"bwghtsum" using the sum function on variable bwght by
the variable high_faminc (Note: need to apply the bysort'
statement)
iv. Apply the "by high_faminc" statement to find the
V.
descriptive statistics of bwght and bwghtsum Include the
output of this code.
Why is there a difference between the standard deviations
of bwght and bwghtsum from part iv of this question?
According to a health information website, the distribution of adults’ diastolic blood pressure (in millimeters of mercury, mmHg) can be modeled by a normal distribution with mean 70 mmHg and standard deviation 20 mmHg.
b. Above what diastolic pressure would classify someone in the highest 1% of blood pressures? Show all calculations used.
Write STATA codes which will generate the outcomes in the questions
& submit the output for each question only when indicated below
i.
ii.
iii.
iv.
V.
Write a code which will allow STATA to go to your favorite folder
to access your files. Load the birthweight1.dta dataset from your
favorite folder and save it under a different filename to protect
data integrity. Call the new dataset babywt.dta (make sure to use
the replace option).
Verify that it contains 2,998 observations and 8 variables. Include
the output of this code.
Are there missing observations for variable(s) for the variables
called bwght, faminc, cigs? How would you know? (You may use
more than one code to show your answer(s)) Include the output
of your code (s).
Write the definitions of these variables: bwght, faminc, male,
white, motheduc,cigs; which of these variables are categorical?
[Hint: use the labels of the variables & the browse command]
Who is this dataset about? Who can use this dataset to answer
what kind of…
Chapter 6 Solutions
Intro Stats, Books a la carte Plus NEW MyLab Statistics with Pearson eText -- Access Card Package (5th Edition)
Ch. 6.2 - Your statistics instructor tells you that the...Ch. 6.2 - Your statistics instructor tells you that the...Ch. 6.2 - Your statistics instructor tells you that the...Ch. 6.2 - Prob. 4JCCh. 6.2 - Prob. 5JCCh. 6 - Association Suppose you were to collect data for...Ch. 6 - Association II Suppose you were to collect data...Ch. 6 - Bookstore sales Consider the following data from a...Ch. 6 - Prob. 4ECh. 6 - Prob. 5E
Ch. 6 - Correlation facts II If we assume that the...Ch. 6 - Prob. 7ECh. 6 - Prob. 8ECh. 6 - Prob. 9ECh. 6 - Prob. 10ECh. 6 - Association III Suppose you were to collect data...Ch. 6 - Association IV Suppose you were to collect data...Ch. 6 - Prob. 13ECh. 6 - Prob. 14ECh. 6 - Prob. 15ECh. 6 - Prob. 16ECh. 6 - Firing pottery A ceramics factory can fire eight...Ch. 6 - Coffee sales Owners of a new coffee shop tracked...Ch. 6 - Matching Here are several scatterplots. The...Ch. 6 - Matching II Here are several scatterplots. The...Ch. 6 - Prob. 21ECh. 6 - Car thefts The National Insurance Crime Bureau...Ch. 6 - Prob. 23ECh. 6 - Antidepressants A study compared the effectiveness...Ch. 6 - Streams and hard water In a study of streams in...Ch. 6 - Traffic headaches A study of traffic delays in 68...Ch. 6 - Cold nights Is there an association between time...Ch. 6 - Association V A researcher investigating the...Ch. 6 - Prob. 29ECh. 6 - Prob. 30ECh. 6 - Correlation errors Your Economics instructor...Ch. 6 - More correlation errors Students in the Economics...Ch. 6 - Height and reading A researcher studies children...Ch. 6 - Prob. 34ECh. 6 - Correlation conclusions I The correlation between...Ch. 6 - Prob. 36ECh. 6 - Prob. 37ECh. 6 - Sample survey A polling organization is checking...Ch. 6 - Income and housing The Office of Federal Housing...Ch. 6 - Interest rates and mortgages 2015 Since 1985,...Ch. 6 - Fuel economy 2016 Here are engine size...Ch. 6 - Drug abuse A survey was conducted in the United...Ch. 6 - Prob. 43ECh. 6 - Burgers again In the previous exercise you...Ch. 6 - Prob. 45ECh. 6 - Second inning 2016 Perhaps fans are just more...Ch. 6 - Prob. 47ECh. 6 - Prob. 48ECh. 6 - Thrills 2013 Since 1994, the Best Roller Coaster...Ch. 6 - Thrills II For the roller coaster data in Exercise...Ch. 6 - Prob. 51ECh. 6 - Vehicle weights The Minnesota Department of...Ch. 6 - Prob. 53ECh. 6 - Flights 2016 Here are the number of domestic...
Additional Math Textbook Solutions
Find more solutions based on key concepts
For Exercises 13–18, write the negation of the statement.
13. The cell phone is out of juice.
Math in Our World
1. How is a sample related to a population?
Elementary Statistics: Picturing the World (7th Edition)
Provide an example of a qualitative variable and an example of a quantitative variable.
Elementary Statistics ( 3rd International Edition ) Isbn:9781260092561
153. A rain gutter is made from sheets of aluminum that are 20 inches wide. As shown in the figure, the edges ...
College Algebra (7th Edition)
Use the ideas in drawings a and b to find the solution to Gausss Problem for the sum 1+2+3+...+n. Explain your ...
A Problem Solving Approach To Mathematics For Elementary School Teachers (13th Edition)
Knowledge Booster


Learn more about
Need a deep-dive on the concept behind this application? Look no further. Learn more about this topic, statistics and related others by exploring similar questions and additional content below.Similar questions
- Apply STATA commands & submit the output for each question only when indicated below İ. ii. iii. iv. V. Apply the command summarize on variables bwght and faminc. What is the average birthweight of babies and family income of the respondents? Include the output of this code. Apply the tab command on the variable called male. How many of the babies and what share of babies are male? Include the output of this code. Find the summary statistics (i.e. use the sum command) of the variables bwght and faminc if the babies are white. Include the output of this code. Find the summary statistics (i.e. use the sum command) of the variables bwght and faminc if the babies are male but not white. Include the output of this code. Using your answers to previous subparts of this question: What is the difference between the average birthweight of a baby who is male and a baby who is male but not white? What can you say anything about the difference in family income of the babies that are male and male…arrow_forwardA public health researcher is studying the impacts of nudge marketing techniques on shoppers vegetablesarrow_forwardThe director of admissions at Kinzua University in Nova Scotia estimated the distribution of student admissions for the fall semester on the basis of past experience. Admissions Probability 1,100 0.5 1,400 0.4 1,300 0.1 Click here for the Excel Data File Required: What is the expected number of admissions for the fall semester? Compute the variance and the standard deviation of the number of admissions. Note: Round your standard deviation to 2 decimal places.arrow_forward
- A pollster randomly selected four of 10 available people. Required: How many different groups of 4 are possible? What is the probability that a person is a member of a group? Note: Round your answer to 3 decimal places.arrow_forwardWind Mountain is an archaeological study area located in southwestern New Mexico. Potsherds are broken pieces of prehistoric Native American clay vessels. One type of painted ceramic vessel is called Mimbres classic black-on-white. At three different sites the number of such sherds was counted in local dwelling excavations. Test given. Site I Site II Site III 63 19 60 43 34 21 23 49 51 48 11 15 16 46 26 20 31 Find .arrow_forwardRothamsted Experimental Station (England) has studied wheat production since 1852. Each year many small plots of equal size but different soil/fertilizer conditions are planted with wheat. At the end of the growing season, the yield (in pounds) of the wheat on the plot is measured. Suppose for a random sample of years, one plot gave the following annual wheat production (in pounds): 4.46 4.21 4.40 4.81 2.81 2.90 4.93 3.54 4.16 4.48 3.26 4.74 4.97 4.02 4.91 2.59 Use a calculator to verify that the sample variance for this plot is . Another random sample of years for a second plot gave the following annual wheat production (in pounds): 3.89 3.81 3.95 4.07 4.01 3.73 4.02 3.78 3.72 3.96 3.62 3.76 4.02 3.73 3.94 4.03 Use a calculator to verify that the sample variance for this plot is . Suppose that we test the claim using that the population variance of annual wheat production for the first plot is larger…arrow_forward
- It is thought that prehistoric Native Americans did not take their best tools, pottery, and household items when they visited higher elevations for their summer camps. It is hypothesized that archaeological sites tend to lose their cultural identity and specific cultural affiliation as the elevation of the site increases. Let x be the elevation (in thousands of feet) for an archaeological site in the southwestern United States. Let y be the percentage of unidentified artifacts (no specific cultural affiliation) at a given elevation. Suppose that the following data were obtained for a collection of archaeological sites in New Mexico: x 5.50 6.00 6.75 7.00 7.75 y 37 38 92 70 99 Find the equation of the least squares line . Round a and b to three decimal places.arrow_forwardA fitness trainer wants to estimate the effect of fitness activities on muscle mass for different weight categories of club members. They choose the most popular fitness classes at the gym: yoga, circuit training, and high-intensity interval training (HIIT). Suppose that the weights of club members are separated into three levels: under 155 pounds, 155 – 200 pounds, and over 200 pounds. Draw a flow chart showing the design of this experiment.arrow_forwardThe systolic blood pressure of individuals is thought to be related to both age and weight. Let the systolic blood pressure, age, and weight be represented by the variables x1, x2, and x3, respectively. Suppose that Minitab was used to generate the following descriptive statistics, correlations, and regression analysis for a random sample of 15 individuals. Descriptive Statistics Variable N Mean Median TrMean StDev SE Mean x 1 15 154.14 154.34 154.14 3.842 0.992000 x 2 15 59.69 60.19 59.69 1.462 0.377487 x 3 15 205.55 204.75 205.55 4.558 1.176871 Variable Minimum Maximum Q1 Q3 x 1 125 178 141.803 167.244 x 2 41 80 47.754 78.415 x 3 126 240 140.395 224.008 Correlations (Pearson) x 1 x 2 x 2 0.892 x 3 0.839 0.567 Regression Analysis The regression equation is x 1 = 0.883 + 1.257x2 + 0.871x3 Predictor Coef StDev T P Constant 0.883 0.635 1.39 0.095 x 2 1.257 0.635 1.98 0.036 x 3 0.871 0.419 2.08 0.030 S = 0.428 R-sq = 92.7 %…arrow_forward
- According to health professionals, a person’s weight is expected to increase with age. To examine that statement, a nutritionist collected data from 11 random females from different age categories between the ages of 21 and 43. In the following table, x is the age of a person and y is the weight in pounds. x, age 21 24 27 29 31 33 35 38 40 42 43 y, weight in lb 121.4 122.3 130.3 131.7 133.3 134.6 136.7 138.4 140.3 142.0 145.1 Select the correct graph of the least-squares line on a scatter diagram.arrow_forwardLet x be a random variable that represents the percentage of successful free throws a professional basketball player makes in a season. Let y be a random variable that represents the percentage of successful field goals a professional basketball player makes in a season. A random sample of n = 6 professional basketball players gave the following information. x 82 69 73 84 74 64 y 42 48 46 46 46 42 Verify that ∑x =446, ∑y =270, ∑x2 =33,442, ∑y2 =12,180, ∑xy =20,070, and r = 0, and find the critical value for a test using a 5% level of significance claiming that ρis not equal than zero. Round your answer to three decimal places.arrow_forwardLet x be a random variable that represents the percentage of successful free throws a professional basketball player makes in a season. Let y be a random variable that represents the percentage of successful field goals a professional basketball player makes in a season. A random sample of n = 6 professional basketball players gave the following information. x 75 72 75 81 74 81 y 46 39 42 47 49 50 Verify that Se ࣈ 3.591,a ࣈ –10.145, bࣈ0.729, and , and find the predicted percentage of successful field goals for a player with x= 88%successful free throws. Round your answer to the nearest tenth of a percentarrow_forward
arrow_back_ios
SEE MORE QUESTIONS
arrow_forward_ios
Recommended textbooks for you
 Glencoe Algebra 1, Student Edition, 9780079039897...AlgebraISBN:9780079039897Author:CarterPublisher:McGraw Hill
 Big Ideas Math A Bridge To Success Algebra 1: Stu...AlgebraISBN:9781680331141Author:HOUGHTON MIFFLIN HARCOURTPublisher:Houghton Mifflin Harcourt
 Holt Mcdougal Larson Pre-algebra: Student Edition...AlgebraISBN:9780547587776Author:HOLT MCDOUGALPublisher:HOLT MCDOUGAL
 Algebra and Trigonometry (MindTap Course List)AlgebraISBN:9781305071742Author:James Stewart, Lothar Redlin, Saleem WatsonPublisher:Cengage Learning
Glencoe Algebra 1, Student Edition, 9780079039897...
Algebra
ISBN:9780079039897
Author:Carter
Publisher:McGraw Hill
Big Ideas Math A Bridge To Success Algebra 1: Stu...
Algebra
ISBN:9781680331141
Author:HOUGHTON MIFFLIN HARCOURT
Publisher:Houghton Mifflin Harcourt
Holt Mcdougal Larson Pre-algebra: Student Edition...
Algebra
ISBN:9780547587776
Author:HOLT MCDOUGAL
Publisher:HOLT MCDOUGAL
Algebra and Trigonometry (MindTap Course List)
Algebra
ISBN:9781305071742
Author:James Stewart, Lothar Redlin, Saleem Watson
Publisher:Cengage Learning
Correlation Vs Regression: Difference Between them with definition & Comparison Chart; Author: Key Differences;https://www.youtube.com/watch?v=Ou2QGSJVd0U;License: Standard YouTube License, CC-BY
Correlation and Regression: Concepts with Illustrative examples; Author: LEARN & APPLY : Lean and Six Sigma;https://www.youtube.com/watch?v=xTpHD5WLuoA;License: Standard YouTube License, CC-BY