
Introductory Statistics
3rd Edition
ISBN: 9780135188927
Author: Gould, Robert, Ryan, Colleen N. (colleen Nooter)
Publisher: Pearson,
expand_more
expand_more
format_list_bulleted
Concept explainers
Videos
Textbook Question
Chapter 6, Problem 43SE
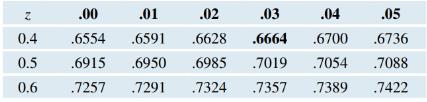
Inverse Normal, Standard In a standard
First locate, inside the table, the number closest to 0.6666.
Then find the
Expert Solution & Answer
Want to see the full answer?
Check out a sample textbook solution
Students have asked these similar questions
In a company with 80 employees, 60 earn $10.00 per hour and 20 earn $13.00 per
hour.
Is this average hourly wage considered representative?
The following is a list of questions answered correctly on an exam. Calculate the
Measures of Central Tendency from the ungrouped data list.
NUMBER OF QUESTIONS ANSWERED CORRECTLY ON AN APTITUDE EXAM
112
72
69
97
107
73
92
76
86
73
126
128
118
127
124
82
104
132
134
83
92
108
96
100
92
115
76
91
102
81
95
141
81
80
106
84
119
113
98
75
68
98
115
106
95
100
85
94
106
119
The following ordered data list shows the data speeds for cell phones used by a
telephone company at an airport:
A. Calculate the Measures of Central Tendency using the table in point B.
B. Are there differences in the measurements obtained in A and C? Why (give at
least one justified reason)?
0.8
1.4
1.8
1.9
3.2
3.6
4.5
4.5
4.6
6.2
6.5
7.7
7.9
9.9
10.2
10.3
10.9
11.1
11.1
11.6
11.8
12.0
13.1
13.5
13.7
14.1
14.2
14.7
15.0
15.1
15.5
15.8
16.0
17.5
18.2
20.2
21.1
21.5
22.2
22.4
23.1
24.5
25.7
28.5
34.6
38.5
43.0
55.6
71.3
77.8
Chapter 6 Solutions
Introductory Statistics
Ch. 6 - Directions Determine whether each of the following...Ch. 6 - 6.1-6.4 Directions Determine whether each of the...Ch. 6 - 6.1-6.4 Directions Determine whether each of the...Ch. 6 - 6.1-6.4 Directions Determine whether each of the...Ch. 6 - Loaded Die (Example 2) A magician has shaved an...Ch. 6 - Prob. 6SECh. 6 - Distribution of Two Thumbtacks When a certain type...Ch. 6 - Two Children Make a list of all possible outcomes...Ch. 6 - Two Thumbtacks a. From your answers in Exercise...Ch. 6 - Two Children Using your list of outcomes in...
Ch. 6 - Snow Depth (Example 3) Eric wants to go skiing...Ch. 6 - Snow Depth Refer to Exercise 6.11. What is the...Ch. 6 - Applying the Empirical Rule with z-Scores The...Ch. 6 - Length of Pregnancy Assume that the lengths of...Ch. 6 - SAT Scores Quantitative SAT scores are...Ch. 6 - Women’s Heights Assume that college women’s...Ch. 6 - Women’s Heights (Example 4) Assume college women’s...Ch. 6 - SAT Scores Quantitative SAT scores are...Ch. 6 - Standard Normal Use the table or technology to...Ch. 6 - Standard Normal Use the table or technology to...Ch. 6 - Standard Normal Use technology or a Normal table...Ch. 6 - Standard Normal Use technology or a Normal table...Ch. 6 - Extreme Positive z -Scores For each question, find...Ch. 6 - Extreme Negative z-Scores For each question, find...Ch. 6 - St. Bernard Dogs (Example 5) According to dogtime...Ch. 6 - Whales Whales have one of the longest gestation...Ch. 6 - Boys’ Foot Length (Example 6) According to the...Ch. 6 - Women’s Foot Length According to the Digital Human...Ch. 6 - Boys’ Foot Length Suppose a shoe store stocks...Ch. 6 - Women’s Foot Length Suppose a shoe store stocks...Ch. 6 - Birth Weights (Example 7) According to the British...Ch. 6 - Birth Lengths According to National Vital...Ch. 6 - White Blood Cells The distribution of white blood...Ch. 6 - Red Blood Cells The distribution of red blood cell...Ch. 6 - SAT Scores in Illinois According to the 2017 SAT...Ch. 6 - SAT Scores in Florida According to the 2017 SAT...Ch. 6 - Arm Span (Men) According to Anthropometric Survey...Ch. 6 - Arm Span (Women) According to Anthropometric...Ch. 6 - New York City Weather New York City’s mean minimum...Ch. 6 - Chicago Weather The average winter daily...Ch. 6 - Probability or Measurement (Inverse)? (Example 8)...Ch. 6 - Probability or Measurement (Inverse)? The Normal...Ch. 6 - Inverse Normal, Standard In a standard Normal...Ch. 6 - Inverse Normal, Standard In a standard Normal...Ch. 6 - Inverse Normal, Standard Assume a standard Normal...Ch. 6 - Inverse Normal, Standard Assume a standard Normal...Ch. 6 - Prob. 47SECh. 6 - Weights of Newborn Hippos The weight of newborn...Ch. 6 - Medical School MCAT Scores on the 2017 MCAT, an...Ch. 6 - Medical School GPA The distribution of grade point...Ch. 6 - Women’s Heights Suppose college women’s heights...Ch. 6 - Men’s Heights Suppose college men’s heights are...Ch. 6 - Inverse SATs Critical reading SAT scores are...Ch. 6 - Inverse Women’s Heights College women have heights...Ch. 6 - Girls’ and Women’s Heights According to the...Ch. 6 - Boys’ and Men’s Heights According to the National...Ch. 6 - Cats’ Birth Weights The average birth weight of...Ch. 6 - Elephants’ Birth Weights The average birth weight...Ch. 6 - Gender of Children (Example 10) A married couple...Ch. 6 - Coin Flip A coin will be flipped four times, and...Ch. 6 - Rolling a Die (Example 11) A die is rolled 5...Ch. 6 - Twins In Exercise 6.59 you are told to assume that...Ch. 6 - Free Throws Professional basketball player...Ch. 6 - On-Time Arrivals Alaska Airlines has an on-time...Ch. 6 - Identifying n,p, and x (Example 12) For each...Ch. 6 - Identifying n,p, and x For each situation,...Ch. 6 - Dog Owners (Example 13) According to the American...Ch. 6 - Cat Owners According to the American Veterinary...Ch. 6 - Passports According to data from the U.S. State...Ch. 6 - Travel According to a survey conducted by OnePoll,...Ch. 6 - Wisconsin Graduation Wisconsin has the highest...Ch. 6 - Colorado Graduation Colorado has a high school...Ch. 6 - Cell Phones According to the Centers of Disease...Ch. 6 - Landlines According to the Centers of Disease...Ch. 6 - Drones (Example 14) The use of drones, aircraft...Ch. 6 - Drones A 2017 Pew Research Center report on drones...Ch. 6 - Texting While Walking According to a report by the...Ch. 6 - Texting While Driving According to a study by the...Ch. 6 - Prob. 79SECh. 6 - Free Throws Professional basketball LeBron James...Ch. 6 - Prob. 81SECh. 6 - Prob. 82SECh. 6 - Discrete or Continuous? Determine whether each of...Ch. 6 - Probability Distribution In a game of chance,...Ch. 6 - Birth Length A study of U.S. births published on...Ch. 6 - Birth Length A study of U.S. births published on...Ch. 6 - Males’ Body Temperatures A study of human body...Ch. 6 - Females’ Body Temperatures A study of human body...Ch. 6 - Prob. 89CRECh. 6 - Medical Licensing See problem 6.89 for information...Ch. 6 - Systolic Blood Pressures Systolic blood pressures...Ch. 6 - Prob. 92CRECh. 6 - Stress According to a 2017 Gallup poll, 44#37; of...Ch. 6 - Stress According to a 2017 Gallup poll, 17 of...Ch. 6 - Voice-Controlled Assistants Voice-controlled video...Ch. 6 - Prob. 96CRECh. 6 - Prob. 97CRECh. 6 - Prob. 98CRECh. 6 - Prob. 99CRECh. 6 - Quantitative SAT Scores, Normal and Binomial The...Ch. 6 - Prob. 101CRECh. 6 - Birth Length and z-Scores, Inverse Babies in the...
Additional Math Textbook Solutions
Find more solutions based on key concepts
Provide an example of a qualitative variable and an example of a quantitative variable.
Elementary Statistics ( 3rd International Edition ) Isbn:9781260092561
153. A rain gutter is made from sheets of aluminum that are 20 inches wide. As shown in the figure, the edges ...
College Algebra (7th Edition)
1. How is a sample related to a population?
Elementary Statistics: Picturing the World (7th Edition)
Check Your Understanding
Reading Check Complete each sentence using > or < for □.
RC1. 3 dm □ 3 dam
Basic College Mathematics
NOTE: Write your answers using interval notation when appropriate.
CHECKING ANALYTIC SKILLS Fill in each blank ...
Graphical Approach To College Algebra
(a) Make a stem-and-leaf plot for these 24 observations on the number of customers who used a down-town CitiBan...
APPLIED STAT.IN BUS.+ECONOMICS
Knowledge Booster


Learn more about
Need a deep-dive on the concept behind this application? Look no further. Learn more about this topic, statistics and related others by exploring similar questions and additional content below.Similar questions
- In a company with 80 employees, 60 earn $10.00 per hour and 20 earn $13.00 per hour. a) Determine the average hourly wage. b) In part a), is the same answer obtained if the 60 employees have an average wage of $10.00 per hour? Prove your answer.arrow_forwardThe following ordered data list shows the data speeds for cell phones used by a telephone company at an airport: A. Calculate the Measures of Central Tendency from the ungrouped data list. B. Group the data in an appropriate frequency table. 0.8 1.4 1.8 1.9 3.2 3.6 4.5 4.5 4.6 6.2 6.5 7.7 7.9 9.9 10.2 10.3 10.9 11.1 11.1 11.6 11.8 12.0 13.1 13.5 13.7 14.1 14.2 14.7 15.0 15.1 15.5 15.8 16.0 17.5 18.2 20.2 21.1 21.5 22.2 22.4 23.1 24.5 25.7 28.5 34.6 38.5 43.0 55.6 71.3 77.8arrow_forwardBusinessarrow_forward
- https://www.hawkeslearning.com/Statistics/dbs2/datasets.htmlarrow_forwardNC Current Students - North Ce X | NC Canvas Login Links - North ( X Final Exam Comprehensive x Cengage Learning x WASTAT - Final Exam - STAT → C webassign.net/web/Student/Assignment-Responses/submit?dep=36055360&tags=autosave#question3659890_9 Part (b) Draw a scatter plot of the ordered pairs. N Life Expectancy Life Expectancy 80 70 600 50 40 30 20 10 Year of 1950 1970 1990 2010 Birth O Life Expectancy Part (c) 800 70 60 50 40 30 20 10 1950 1970 1990 W ALT 林 $ # 4 R J7 Year of 2010 Birth F6 4+ 80 70 60 50 40 30 20 10 Year of 1950 1970 1990 2010 Birth Life Expectancy Ox 800 70 60 50 40 30 20 10 Year of 1950 1970 1990 2010 Birth hp P.B. KA & 7 80 % 5 H A B F10 711 N M K 744 PRT SC ALT CTRLarrow_forwardHarvard University California Institute of Technology Massachusetts Institute of Technology Stanford University Princeton University University of Cambridge University of Oxford University of California, Berkeley Imperial College London Yale University University of California, Los Angeles University of Chicago Johns Hopkins University Cornell University ETH Zurich University of Michigan University of Toronto Columbia University University of Pennsylvania Carnegie Mellon University University of Hong Kong University College London University of Washington Duke University Northwestern University University of Tokyo Georgia Institute of Technology Pohang University of Science and Technology University of California, Santa Barbara University of British Columbia University of North Carolina at Chapel Hill University of California, San Diego University of Illinois at Urbana-Champaign National University of Singapore McGill…arrow_forward
- Name Harvard University California Institute of Technology Massachusetts Institute of Technology Stanford University Princeton University University of Cambridge University of Oxford University of California, Berkeley Imperial College London Yale University University of California, Los Angeles University of Chicago Johns Hopkins University Cornell University ETH Zurich University of Michigan University of Toronto Columbia University University of Pennsylvania Carnegie Mellon University University of Hong Kong University College London University of Washington Duke University Northwestern University University of Tokyo Georgia Institute of Technology Pohang University of Science and Technology University of California, Santa Barbara University of British Columbia University of North Carolina at Chapel Hill University of California, San Diego University of Illinois at Urbana-Champaign National University of Singapore…arrow_forwardA company found that the daily sales revenue of its flagship product follows a normal distribution with a mean of $4500 and a standard deviation of $450. The company defines a "high-sales day" that is, any day with sales exceeding $4800. please provide a step by step on how to get the answers in excel Q: What percentage of days can the company expect to have "high-sales days" or sales greater than $4800? Q: What is the sales revenue threshold for the bottom 10% of days? (please note that 10% refers to the probability/area under bell curve towards the lower tail of bell curve) Provide answers in the yellow cellsarrow_forwardFind the critical value for a left-tailed test using the F distribution with a 0.025, degrees of freedom in the numerator=12, and degrees of freedom in the denominator = 50. A portion of the table of critical values of the F-distribution is provided. Click the icon to view the partial table of critical values of the F-distribution. What is the critical value? (Round to two decimal places as needed.)arrow_forward
- A retail store manager claims that the average daily sales of the store are $1,500. You aim to test whether the actual average daily sales differ significantly from this claimed value. You can provide your answer by inserting a text box and the answer must include: Null hypothesis, Alternative hypothesis, Show answer (output table/summary table), and Conclusion based on the P value. Showing the calculation is a must. If calculation is missing,so please provide a step by step on the answers Numerical answers in the yellow cellsarrow_forwardShow all workarrow_forwardShow all workarrow_forward
arrow_back_ios
SEE MORE QUESTIONS
arrow_forward_ios
Recommended textbooks for you
 College Algebra (MindTap Course List)AlgebraISBN:9781305652231Author:R. David Gustafson, Jeff HughesPublisher:Cengage Learning
 Big Ideas Math A Bridge To Success Algebra 1: Stu...AlgebraISBN:9781680331141Author:HOUGHTON MIFFLIN HARCOURTPublisher:Houghton Mifflin Harcourt
 Glencoe Algebra 1, Student Edition, 9780079039897...AlgebraISBN:9780079039897Author:CarterPublisher:McGraw Hill
 Holt Mcdougal Larson Pre-algebra: Student Edition...AlgebraISBN:9780547587776Author:HOLT MCDOUGALPublisher:HOLT MCDOUGAL
College Algebra (MindTap Course List)
Algebra
ISBN:9781305652231
Author:R. David Gustafson, Jeff Hughes
Publisher:Cengage Learning
Big Ideas Math A Bridge To Success Algebra 1: Stu...
Algebra
ISBN:9781680331141
Author:HOUGHTON MIFFLIN HARCOURT
Publisher:Houghton Mifflin Harcourt
Glencoe Algebra 1, Student Edition, 9780079039897...
Algebra
ISBN:9780079039897
Author:Carter
Publisher:McGraw Hill
Holt Mcdougal Larson Pre-algebra: Student Edition...
Algebra
ISBN:9780547587776
Author:HOLT MCDOUGAL
Publisher:HOLT MCDOUGAL
Continuous Probability Distributions - Basic Introduction; Author: The Organic Chemistry Tutor;https://www.youtube.com/watch?v=QxqxdQ_g2uw;License: Standard YouTube License, CC-BY
Probability Density Function (p.d.f.) Finding k (Part 1) | ExamSolutions; Author: ExamSolutions;https://www.youtube.com/watch?v=RsuS2ehsTDM;License: Standard YouTube License, CC-BY
Find the value of k so that the Function is a Probability Density Function; Author: The Math Sorcerer;https://www.youtube.com/watch?v=QqoCZWrVnbA;License: Standard Youtube License