Length of Pregnancy Assume that the lengths of pregnancy for humans is approximately Normally distributed , with a mean of 267 days and a standard deviation of 10 days. Use the Empirical Rule to answer the following questions. Do not use the technology or the Normal table. Begin by labeling the horizontal axis of the graph with lengths, using the given mean and standard deviation. Three of the entries are done for you. a. Roughly what percentage of pregnancies last more than 267 days? i. almost all ii. 95% iii. 68% iv. 50% b. Roughly what percentage of pregnancies last between 267 and 277 days? i. 34% ii. 17% iii. 2.5% iv. 50% c. Roughly what percentage of pregnancies last less than 237 days? i. almost all ii. 50% iii. 34% iv. about 0% d. Roughly what percentage of pregnancies last between 247 and 287 days? i. almost all ii. 95% iii. 68% iv. 50% e. Roughly what percentage of pregnancies last longer than 287 days? i. 34% ii. 17% iii. 2.5% iv. 50% f. Roughly what percentage of pregnancies last longer than 297 days? i. almost all ii. 50% iii. 34% iv. about 0%
Length of Pregnancy Assume that the lengths of pregnancy for humans is approximately Normally distributed , with a mean of 267 days and a standard deviation of 10 days. Use the Empirical Rule to answer the following questions. Do not use the technology or the Normal table. Begin by labeling the horizontal axis of the graph with lengths, using the given mean and standard deviation. Three of the entries are done for you. a. Roughly what percentage of pregnancies last more than 267 days? i. almost all ii. 95% iii. 68% iv. 50% b. Roughly what percentage of pregnancies last between 267 and 277 days? i. 34% ii. 17% iii. 2.5% iv. 50% c. Roughly what percentage of pregnancies last less than 237 days? i. almost all ii. 50% iii. 34% iv. about 0% d. Roughly what percentage of pregnancies last between 247 and 287 days? i. almost all ii. 95% iii. 68% iv. 50% e. Roughly what percentage of pregnancies last longer than 287 days? i. 34% ii. 17% iii. 2.5% iv. 50% f. Roughly what percentage of pregnancies last longer than 297 days? i. almost all ii. 50% iii. 34% iv. about 0%
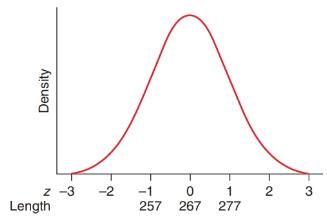
Solution Summary: The given graph represents the density curve for the length of the pregnancy for humans with the mean of 267 days, and standard deviation of 10 days.
Length of Pregnancy Assume that the lengths of pregnancy for humans is approximately Normally distributed, with a mean of 267 days and a standard deviation of 10 days. Use the Empirical Rule to answer the following questions. Do not use the technology or the Normal table. Begin by labeling the horizontal axis of the graph with lengths, using the given mean and standard deviation. Three of the entries are done for you.
a. Roughly what percentage of pregnancies last more than 267 days?
i. almost all
ii. 95%
iii. 68%
iv. 50%
b. Roughly what percentage of pregnancies last between 267 and 277 days?
i. 34%
ii. 17%
iii. 2.5%
iv. 50%
c. Roughly what percentage of pregnancies last less than 237 days?
i. almost all
ii. 50%
iii. 34%
iv. about 0%
d. Roughly what percentage of pregnancies last between 247 and 287 days?
i. almost all
ii. 95%
iii. 68%
iv. 50%
e. Roughly what percentage of pregnancies last longer than 287 days?
i. 34%
ii. 17%
iii. 2.5%
iv. 50%
f. Roughly what percentage of pregnancies last longer than 297 days?
i. almost all
ii. 50%
iii. 34%
iv. about 0%
Features Features Normal distribution is characterized by two parameters, mean (µ) and standard deviation (σ). When graphed, the mean represents the center of the bell curve and the graph is perfectly symmetric about the center. The mean, median, and mode are all equal for a normal distribution. The standard deviation measures the data's spread from the center. The higher the standard deviation, the more the data is spread out and the flatter the bell curve looks. Variance is another commonly used measure of the spread of the distribution and is equal to the square of the standard deviation.
We consider the one-period model studied in class as an example. Namely, we assumethat the current stock price is S0 = 10. At time T, the stock has either moved up toSt = 12 (with probability p = 0.6) or down towards St = 8 (with probability 1−p = 0.4).We consider a call option on this stock with maturity T and strike price K = 10. Theinterest rate on the money market is zero.As in class, we assume that you, as a customer, are willing to buy the call option on100 shares of stock for $120. The investor, who sold you the option, can adopt one of thefollowing strategies: Strategy 1: (seen in class) Buy 50 shares of stock and borrow $380. Strategy 2: Buy 55 shares of stock and borrow $430. Strategy 3: Buy 60 shares of stock and borrow $480. Strategy 4: Buy 40 shares of stock and borrow $280.(a) For each of strategies 2-4, describe the value of the investor’s portfolio at time 0,and at time T for each possible movement of the stock.(b) For each of strategies 2-4, does the investor have…
Negate the following compound statement using De Morgans's laws.
Negate the following compound statement using De Morgans's laws.
Need a deep-dive on the concept behind this application? Look no further. Learn more about this topic, statistics and related others by exploring similar questions and additional content below.
Continuous Probability Distributions - Basic Introduction; Author: The Organic Chemistry Tutor;https://www.youtube.com/watch?v=QxqxdQ_g2uw;License: Standard YouTube License, CC-BY
Probability Density Function (p.d.f.) Finding k (Part 1) | ExamSolutions; Author: ExamSolutions;https://www.youtube.com/watch?v=RsuS2ehsTDM;License: Standard YouTube License, CC-BY
Find the value of k so that the Function is a Probability Density Function; Author: The Math Sorcerer;https://www.youtube.com/watch?v=QqoCZWrVnbA;License: Standard Youtube License


 Big Ideas Math A Bridge To Success Algebra 1: Stu...AlgebraISBN:9781680331141Author:HOUGHTON MIFFLIN HARCOURTPublisher:Houghton Mifflin Harcourt
 Glencoe Algebra 1, Student Edition, 9780079039897...AlgebraISBN:9780079039897Author:CarterPublisher:McGraw Hill
 Holt Mcdougal Larson Pre-algebra: Student Edition...AlgebraISBN:9780547587776Author:HOLT MCDOUGALPublisher:HOLT MCDOUGAL
 College Algebra (MindTap Course List)AlgebraISBN:9781305652231Author:R. David Gustafson, Jeff HughesPublisher:Cengage Learning
 Algebra: Structure And Method, Book 1AlgebraISBN:9780395977224Author:Richard G. Brown, Mary P. Dolciani, Robert H. Sorgenfrey, William L. ColePublisher:McDougal Littell