
Videos
Plot the
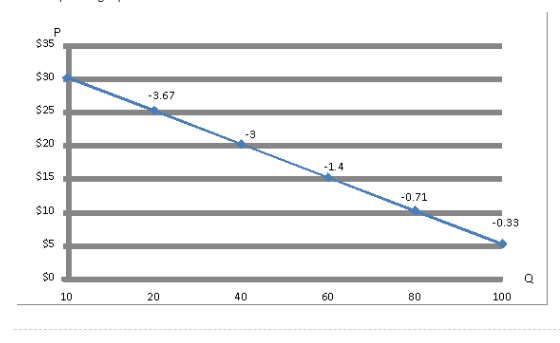
Reason behind the elasticity value getting smaller with the downward movement on demand curve.
Explanation of Solution
The required graph is below:
- The arc or mid- point elasticity is calculated as follows:
Elasticity of Demand (Ed)
Where Ed = coefficient of elasticity
P1 = Initial Price
P2 = New Price
Q1 = Initial Quantity
Q2 = New Quantity
At price $5 per unit, quantity demanded = 100 units
At price $10 per unit, quantity demanded = 80 units
Thus, at the first point where price = $5 per unit, quantity demanded = 100 units
P1= $10 P2 = $5
Q1 = 80 Q2 = 100
Price elasticity of demand = -0.33
At price $10 per unit, the quantity demanded is 80 units, elasticity of demand is calculated as follows:
P1= $10 P2 = $15
Q1 = 80 Q2 = 60
At price $10 per unit, price elasticity of demand is -0.71.
At price $15 per unit, quantity demanded is 60 units, elasticity is calculated as follows:
P1 = $15 P2= $20
Q1 = 60 Q2= 40
Thus, at price $15 per unit, price elasticity of demand is -1.4
At price $20 per unit, quantity demanded is 40 units, sp, elasticity is calculated as follows:
P1 = $25 P2= $25
Q1 = 40 Q2= 20
Thus, at price $20 per unit, price elasticity of demand is -3.
At price $25 per unit, quantity demanded is 20 units, so, elasticity is calculated as follows:
P1 = $25 P2= $30
Q1 = 20 Q2= 10
Thus, at price $25 per unit, price elasticity of demand is -3.67
b)
Using price changes of $10, we compare the price and quantity changes with $10 increments. We will still follow the same mid point formula.
At price $5 per unit, quantity demanded is 100 units and at price $15 per unit, the quantity demanded is 60 units, thus elasticity at $5 per unit is:
P1 = $5 P2= $15
Q1 = 100 Q2= 60
Thus, at price $5 with price changes of $10, price elasticity of demand is -0.5
At price $10 per unit, the quantity demanded is 80 units and at price $20 per unit, quantity demanded is 40 units, thus elasticity at $10 per unit is:
Thus, at price $10 with price changes of $10, price elasticity of demand is -1
At price $15 per unit, the quantity demanded is 60 units and at price $25 per unit, quantity demanded is 20 units, thus elasticity at $15 per unit is:
Thus, at price $15 with price changes of $10, price elasticity of demand is -2
At price $20 per unit, the quantity demanded is 40 units and at price $30 per unit, quantity demanded is 10 units, thus elasticity at $25 per unit is:
Price elasticity (Ed) is the ratio of percentage change in quantity demanded upon percentage change in price.
Want to see more full solutions like this?


- Not use ai pleasearrow_forward2. Every time we start to have fun, the government ruins it! You run a construction company where you build residential homes. For the past 3 years, demand for new homes has risen significantly, and your company tripled its size. The main driver for the rise in demand is high GDP growth. People are making good incomes, and they are demanding more houses. The positive outlook many people have about the economy makes you believe that you need to expand your business even further to another state, which requires you to open an office there and hire at least 50 people. While sitting with your family in the evening enjoying some sweets and watching TV, you heard the news reporter state the following: "The central bank has decided to raise interest rates to influence consumer spending to try to control inflation. The economy has been doing very well for 3 consecutive years, and economic growth is still accelerating, which could lead to a spike in prices." Your spouse, who was watching TV…arrow_forward1. You only need to speak 400 languages in Sudan! Sudan, a country rich in culture and natural resources, is in the northeastern part of the continent of Africa. Sudan has more than 500 distinct ethnic groups and over 400 languages. According to the International Monetary Fund, GDP growth rate in Sudan was negative 4.2% (-4.2%) as of April of 2024. Two politicians came forward and proposed different ways to solve the GDP negative growth and to achieve full employment. They are Mr. Abdul and Mrs. Ibrahim. Mr. Abdul’s proposal is this: Because people don’t have money to spend, let’s give them $5,000 each. This way they can have what they need and improve their standard of living. Their demand for goods and services will then stimulate production and, thus, the demand for labor, leading to a lower unemployment rate. Mrs. Ibrahim’s proposal is this: Because production in the economy is low, leading to a decline in GDP, let’s lower the interest rate so people will borrow more money to…arrow_forward
- You are the manager of a monopoly that sells a product to two groups of consumers in different parts of the country. Analysts at your firm have determined that group s elasticity of demand is while group s is Your marginal cost of producing the product is $ a Determine your optimal markups and prices under thirddegree price discrimination. b Identify the conditions under which thirddegree price discrimination enhances profits.arrow_forwardDon't used hand raiting and don't used Ai solutionarrow_forwardDemand and supply functionarrow_forward
- Not use ai pleasearrow_forwardThanks!arrow_forwardIf there is an oil shock, what will happen to the market for thick metal tables (they are very heavy)? Group of answer choices P decreases and Q increases. P decreases and Q decreases. P increases and Q decreases. P increases and Q increases.arrow_forward
- Facebook (not Mark Zuckerberg) would do which of the following actions according the Circular Flow diagram? Group of answer choices Buys, but does not sell. Sell and Buy (or Rent). Does not sell nor buys. Sell, but does not buy.arrow_forwardFirms would do which of the following actions according the Circular Flow diagram? Group of answer choices Sell, but does not buy. Sell and Buy (or Rent). Buys, but does not sell. Does not sell nor buys.arrow_forwardWhen the price of a good or a service increases, _______? Group of answer choices The demand curve shifts in the same direction. The supply curve shifts in the opposite direction. The demand curve shifts in the opposite direction. There is a movement along the demand curve.arrow_forward


 Economics Today and Tomorrow, Student EditionEconomicsISBN:9780078747663Author:McGraw-HillPublisher:Glencoe/McGraw-Hill School Pub Co
 Economics (MindTap Course List)EconomicsISBN:9781337617383Author:Roger A. ArnoldPublisher:Cengage Learning