
EBK FUNDAMENTALS OF BIOSTATISTICS
8th Edition
ISBN: 9781305465510
Author: Rosner
Publisher: YUZU
expand_more
expand_more
format_list_bulleted
Concept explainers
Videos
Textbook Question
Chapter 6, Problem 23P
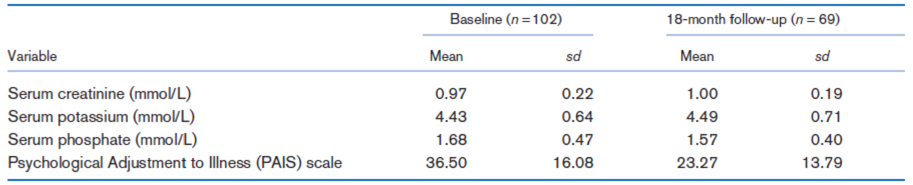
A study of psychological and physiological health in a cohort of dialysis patients with end-stage renal disease was conducted [7]. Psychological and physiological parameters were initially determined at baseline in 102 patients; these parameters were determined again in 69 of the 102 patients at an 18-month follow-up visit. The data in Table 6.12 were reported.
Table 6.12 Psychological and physiological parameters in patients with end-stage renal disease
 Provide a point and
Expert Solution & Answer
Want to see the full answer?
Check out a sample textbook solution
Students have asked these similar questions
Question 2
A nickel-titanium alloy is used to make components for jet turbine aircraft engines. Cracking is a potentially
serious problem in the final part because it can lead to nonrecoverable failure. A test is run at the parts producer
to determine the effect of four factors on cracks. The four factors are: pouring temperature (A), titanium content
(B), heat treatment method (C), amount of grain refiner used (D). Two replicates of a 24 design are run, and
the length of crack (in mm x10-2) induced in a sample coupon subjected to a standard test is measured. The
data are shown in Table 2.
1
(a) Estimate the factor effects. Which factor effects appear to be large?
(b) Conduct an analysis of variance. Do any of the factors affect cracking? Use a = 0.05.
(c) Write down a regression model that can be used to predict crack length as a function of the significant
main effects and interactions you have identified in part (b).
(d) Analyze the residuals from this experiment.
(e) Is there an…
A 24-1 design has been used to investigate the effect of four factors on the resistivity of a silicon wafer. The data
from this experiment are shown in Table 4.
Table 4: Resistivity Experiment for Exercise 5
Run
A
B
с
D
Resistivity
1
23
2
3
4
5
6
7
8
9
10
11
12
I+I+I+I+Oooo
0
0
||++TI++o000
33.2
4.6
31.2
9.6
40.6
162.4
39.4
158.6
63.4
62.6
58.7
0
0
60.9
3
(a) Estimate the factor effects. Plot the effect estimates on a normal probability scale.
(b) Identify a tentative model for this process. Fit the model and test for curvature.
(c) Plot the residuals from the model in part (b) versus the predicted resistivity. Is there any indication on
this plot of model inadequacy?
(d) Construct a normal probability plot of the residuals. Is there any reason to doubt the validity of the
normality assumption?
Stem1: 1,4
Stem 2: 2,4,8
Stem3: 2,4
Stem4: 0,1,6,8
Stem5: 0,1,2,3,9
Stem 6: 2,2
What’s the Min,Q1, Med,Q3,Max?
Chapter 6 Solutions
EBK FUNDAMENTALS OF BIOSTATISTICS
Ch. 6.5 - What is the difference between a standard...Ch. 6.5 - What does a 95% CI mean?Ch. 6 - Suppose we are asked to construct a list of...Ch. 6 - Suppose we are asked to construct a list of...Ch. 6 - Suppose we are asked to construct a list of...Ch. 6 - Suppose we are asked to construct a list of...Ch. 6 - The data in Table 6.10 concern the mean triceps...Ch. 6 - The data in Table 6.10 concern the mean triceps...Ch. 6 - The data in Table 6.10 concern the mean triceps...Ch. 6 - The data in Table 6.10 concern the mean triceps...
Ch. 6 - The data in Table 6.10 concern the mean triceps...Ch. 6 - The data in Table 6.10 concern the mean triceps...Ch. 6 - Refer to the data in Table 2.13. Regard this...Ch. 6 - Refer to the data in Table 2.13. Regard this...Ch. 6 - Refer to the data in Table 2.13. Regard this...Ch. 6 - Refer to the data in Table 2.13. Regard this...Ch. 6 - Refer to the data in Table 2.13. Regard this...Ch. 6 - Refer to the data in Table 2.13. Regard this...Ch. 6 - Refer to the data in Table 2.13. Regard this...Ch. 6 - A nine-laboratory cooperative study was performed...Ch. 6 - A nine-laboratory cooperative study was performed...Ch. 6 - A nine-laboratory cooperative study was performed...Ch. 6 - A nine-laboratory cooperative study was performed...Ch. 6 - A nine-laboratory cooperative study was performed...Ch. 6 - A study of psychological and physiological health...Ch. 6 - A study of psychological and physiological health...Ch. 6 - A study is conducted to test the hypothesis that...Ch. 6 - A study is conducted to test the hypothesis that...Ch. 6 - Suppose a clinical trial is conducted to test the...Ch. 6 - Suppose a clinical trial is conducted to test the...Ch. 6 - Suppose a clinical trial is conducted to test the...Ch. 6 - Suppose we want to estimate the concentration...Ch. 6 - Suppose we want to estimate the concentration...Ch. 6 - Suppose we want to estimate the concentration...Ch. 6 - Much discussion has taken place concerning...Ch. 6 - Much discussion has taken place concerning...Ch. 6 - Much discussion has taken place concerning...Ch. 6 - A new assay is developed to obtain the...Ch. 6 - A new assay is developed to obtain the...Ch. 6 - A new assay is developed to obtain the...Ch. 6 - A new assay is developed to obtain the...Ch. 6 - Suppose 100 hypertensive people are given an...Ch. 6 - Suppose 100 hypertensive people are given an...Ch. 6 - Suppose 100 hypertensive people are given an...Ch. 6 - Suppose we decide a better measure of the...Ch. 6 - Suppose we decide a better measure of the...Ch. 6 - Suppose we decide a better measure of the...Ch. 6 - Suppose we decide a better measure of the...Ch. 6 - Draw six random samples of size 5 from the data in...Ch. 6 - Draw six random samples of size 5 from the data in...Ch. 6 - Draw six random samples of size 5 from the data in...Ch. 6 - Draw six random samples of size 5 from the data in...Ch. 6 - Draw six random samples of size 5 from the data in...Ch. 6 - Figure 6.4b (p. 172) plotted the sampling...Ch. 6 - Figure 6.4b (p. 172) plotted the sampling...Ch. 6 - Figure 6.4b (p. 172) plotted the sampling...Ch. 6 - Figure 6.4b (p. 172) plotted the sampling...Ch. 6 - The etiology of high blood pressure remains a...Ch. 6 - The etiology of high blood pressure remains a...Ch. 6 - The etiology of high blood pressure remains a...Ch. 6 - Data Set SEXRAT.DAT, at www.cengagebrain.com,...Ch. 6 - A cohort of hemophiliacs is followed to elicit...Ch. 6 - A cohort of hemophiliacs is followed to elicit...Ch. 6 - A cohort of hemophiliacs is followed to elicit...Ch. 6 - We have previously described Data Set LEAD.DAT (at...Ch. 6 - We have previously described Data Set LEAD.DAT (at...Ch. 6 - We have previously described Data Set LEAD.DAT (at...Ch. 6 - Data Set NIFED.DAT (at www.cengagebrain.com) was...Ch. 6 - Data Set NIFED.DAT (at www.cengagebrain.com) was...Ch. 6 - Data Set NIFED.DAT (at www.cengagebrain.com) was...Ch. 6 - Suppose that there are 6 deaths due to bladder...Ch. 6 - Suppose that there are 4 deaths due to stomach...Ch. 6 - The value of mammography as a screening test for...Ch. 6 - The value of mammography as a screening test for...Ch. 6 - The value of mammography as a screening test for...Ch. 6 - The value of mammography as a screening test for...Ch. 6 - On the computer, draw 1000 bootstrap samples of...Ch. 6 - On the computer, draw 1000 bootstrap samples of...Ch. 6 - A study was performed to investigate the...Ch. 6 - A study was performed to investigate the...Ch. 6 - Refer to Data Set BONEDEN.DAT at...Ch. 6 - Refer to Data Set BONEDEN.DAT at...Ch. 6 - Prob. 88PCh. 6 - Prob. 89PCh. 6 - Prob. 90PCh. 6 - Prob. 91PCh. 6 - Prob. 92PCh. 6 - Prob. 93PCh. 6 - Prob. 94PCh. 6 - Prob. 95PCh. 6 - Prob. 96PCh. 6 - A patient who is taking antihypertensive...Ch. 6 - A patient who is taking antihypertensive...Ch. 6 - A patient who is taking antihypertensive...Ch. 6 - A patient who is taking antihypertensive...Ch. 6 - A patient who is taking antihypertensive...Ch. 6 - Injuries are common in football and may be related...Ch. 6 - Injuries are common in football and may be related...Ch. 6 - A hypertensive patient has been on...Ch. 6 - A hypertensive patient has been on...Ch. 6 - A hypertensive patient has been on...Ch. 6 - A hypertensive patient has been on...Ch. 6 - A radiologist investigates whether a new (less...Ch. 6 - A radiologist investigates whether a new (less...Ch. 6 - The estimation of allele probabilities is...Ch. 6 - The estimation of allele probabilities is...Ch. 6 - The estimation of allele probabilities is...Ch. 6 - As an experiment, 10,000 people are completely...Ch. 6 - As an experiment, 10,000 people are completely...Ch. 6 - Which of the following sample results yields a 95%...Ch. 6 - Suppose we observe 30 cases of colon cancer over...
Knowledge Booster


Learn more about
Need a deep-dive on the concept behind this application? Look no further. Learn more about this topic, statistics and related others by exploring similar questions and additional content below.Similar questions
- Are the t-statistics here greater than 1.96? What do you conclude? colgPA= 1.39+0.412 hsGPA (.33) (0.094) Find the P valuearrow_forwardA poll before the elections showed that in a given sample 79% of people vote for candidate C. How many people should be interviewed so that the pollsters can be 99% sure that from 75% to 83% of the population will vote for candidate C? Round your answer to the whole number.arrow_forwardSuppose a random sample of 459 married couples found that 307 had two or more personality preferences in common. In another random sample of 471 married couples, it was found that only 31 had no preferences in common. Let p1 be the population proportion of all married couples who have two or more personality preferences in common. Let p2 be the population proportion of all married couples who have no personality preferences in common. Find a95% confidence interval for . Round your answer to three decimal places.arrow_forward
- A history teacher interviewed a random sample of 80 students about their preferences in learning activities outside of school and whether they are considering watching a historical movie at the cinema. 69 answered that they would like to go to the cinema. Let p represent the proportion of students who want to watch a historical movie. Determine the maximal margin of error. Use α = 0.05. Round your answer to three decimal places. arrow_forwardA random sample of medical files is used to estimate the proportion p of all people who have blood type B. If you have no preliminary estimate for p, how many medical files should you include in a random sample in order to be 99% sure that the point estimate will be within a distance of 0.07 from p? Round your answer to the next higher whole number.arrow_forwardA clinical study is designed to assess the average length of hospital stay of patients who underwent surgery. A preliminary study of a random sample of 70 surgery patients’ records showed that the standard deviation of the lengths of stay of all surgery patients is 7.5 days. How large should a sample to estimate the desired mean to within 1 day at 95% confidence? Round your answer to the whole number.arrow_forward
- A clinical study is designed to assess the average length of hospital stay of patients who underwent surgery. A preliminary study of a random sample of 70 surgery patients’ records showed that the standard deviation of the lengths of stay of all surgery patients is 7.5 days. How large should a sample to estimate the desired mean to within 1 day at 95% confidence? Round your answer to the whole number.arrow_forwardIn the experiment a sample of subjects is drawn of people who have an elbow surgery. Each of the people included in the sample was interviewed about their health status and measurements were taken before and after surgery. Are the measurements before and after the operation independent or dependent samples?arrow_forwardiid 1. The CLT provides an approximate sampling distribution for the arithmetic average Ỹ of a random sample Y₁, . . ., Yn f(y). The parameters of the approximate sampling distribution depend on the mean and variance of the underlying random variables (i.e., the population mean and variance). The approximation can be written to emphasize this, using the expec- tation and variance of one of the random variables in the sample instead of the parameters μ, 02: YNEY, · (1 (EY,, varyi n For the following population distributions f, write the approximate distribution of the sample mean. (a) Exponential with rate ẞ: f(y) = ß exp{−ßy} 1 (b) Chi-square with degrees of freedom: f(y) = ( 4 ) 2 y = exp { — ½/ } г( (c) Poisson with rate λ: P(Y = y) = exp(-\} > y! y²arrow_forward
- 2. Let Y₁,……., Y be a random sample with common mean μ and common variance σ². Use the CLT to write an expression approximating the CDF P(Ỹ ≤ x) in terms of µ, σ² and n, and the standard normal CDF Fz(·).arrow_forwardmatharrow_forwardCompute the median of the following data. 32, 41, 36, 42, 29, 30, 40, 22, 25, 37arrow_forward
arrow_back_ios
SEE MORE QUESTIONS
arrow_forward_ios
Recommended textbooks for you
 Big Ideas Math A Bridge To Success Algebra 1: Stu...AlgebraISBN:9781680331141Author:HOUGHTON MIFFLIN HARCOURTPublisher:Houghton Mifflin Harcourt
 Glencoe Algebra 1, Student Edition, 9780079039897...AlgebraISBN:9780079039897Author:CarterPublisher:McGraw Hill
Big Ideas Math A Bridge To Success Algebra 1: Stu...
Algebra
ISBN:9781680331141
Author:HOUGHTON MIFFLIN HARCOURT
Publisher:Houghton Mifflin Harcourt
Glencoe Algebra 1, Student Edition, 9780079039897...
Algebra
ISBN:9780079039897
Author:Carter
Publisher:McGraw Hill
Correlation Vs Regression: Difference Between them with definition & Comparison Chart; Author: Key Differences;https://www.youtube.com/watch?v=Ou2QGSJVd0U;License: Standard YouTube License, CC-BY
Correlation and Regression: Concepts with Illustrative examples; Author: LEARN & APPLY : Lean and Six Sigma;https://www.youtube.com/watch?v=xTpHD5WLuoA;License: Standard YouTube License, CC-BY