Loose-Leaf Essentials of Investments
10th Edition
ISBN: 9781259604966
Author: Kane, Alex, Marcus Professor, Alan J., Bodie Professor, Zvi
Publisher: McGraw-Hill Education
expand_more
expand_more
format_list_bulleted
Textbook Question
Chapter 6, Problem 21PS
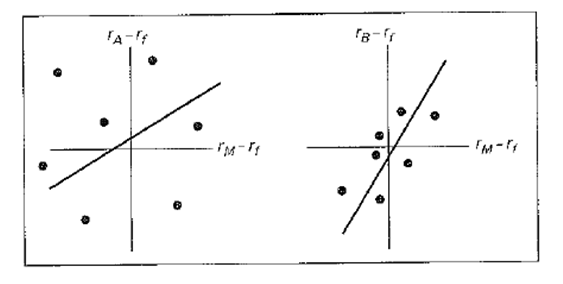
The following figure shows plots of monthly
a. Which stock is riskier to an investor currently holding a diversified portfolio of common stock?
b. Which stock is riskier to an undiversified investor who puts all of his funds in only one of these stocks?

Expert Solution & Answer
Trending nowThis is a popular solution!

Students have asked these similar questions
Description
Discuss in detail the Goal(s) of the firm. Additionally, List and discuss the 5 principles that form the
foundations of finance. Lastly, List and discuss the various legal forms of business organizations.
What is the purpose of a case studty?
Why is it important for researchers? Please give the examples
Investors in corporate zero-coupon bonds include all of the following EXCEPT: A: Tax-exempt retirement plans B: Conservative investors who want to lock-in their returns C: Investors who are saving for their children's college education D: Investors who do not need current cash flows E: All of the above are potential zero-coupon investors
Chapter 6 Solutions
Loose-Leaf Essentials of Investments
Ch. 6 - Prob. 1PSCh. 6 - When adding a risky asset to a portfolio of many...Ch. 6 - A portfolio’s expected return is 12%, its standard...Ch. 6 - An investor ponders various allocations to the...Ch. 6 - The standard deviation of the market-index...Ch. 6 - Suppose that the returns on the stock fund...Ch. 6 - Use the rate-of-return data for the stock and bond...Ch. 6 - Prob. 8PSCh. 6 - Prob. 9PSCh. 6 - Prob. 10PS
Ch. 6 - Prob. 11PSCh. 6 - Prob. 12PSCh. 6 - Prob. 13PSCh. 6 - Suppose that many stocks are traded in the market...Ch. 6 - You can find a spreadsheet containing annual...Ch. 6 - Assume expected returns and standard deviations...Ch. 6 - Prob. 17PSCh. 6 - Prob. 18PSCh. 6 - A project has a 0.7 chance of doubling your...Ch. 6 - Investors expect the market rate of return this...Ch. 6 - The following figure shows plots of monthly rates...Ch. 6 - Prob. 22PSCh. 6 - Prob. 23PSCh. 6 - Prob. 25CCh. 6 - Prob. 1CPCh. 6 - Prob. 2CPCh. 6 - Abigail Grace has a $900,000 fully diversified...Ch. 6 - Prob. 4CPCh. 6 - Prob. 5CPCh. 6 - Prob. 6CPCh. 6 - Prob. 7CPCh. 6 - Prob. 1WMCh. 6 - Following the procedures in the previous question,...Ch. 6 - Prob. 3WMCh. 6 - Prob. 4WM
Knowledge Booster
Learn more about
Need a deep-dive on the concept behind this application? Look no further. Learn more about this topic, finance and related others by exploring similar questions and additional content below.Similar questions
- What are some of Airbnb Legal Issues? How have Airbnb Resolved these Legal issues?WHat happened in the legal problem with Airbnb and Italy?arrow_forwardWhat are AIrbnb's Legal Foundations? What are Airbnb's Business Ethics? What are Airbnb's Corporate Social Responsibility?arrow_forwardDiscuss in detail the differences between the Primary Markets versus the Secondary Markets, The Money Market versus the Capital Market AND the Spot Market versus the Futures Market. Additionally, discuss the various Interest Rate Determinants listed in your textbook (such as default-risk premium.....).arrow_forward
- How can the book value still serve as a useful metric for investors despite the dominance of market value?arrow_forwardHow do you think companies can practically ensure that stakeholder interests are genuinely considered, while still prioritizing the financial goal of maximizing shareholder equity? Do you think there’s a way to measure and track this balance effectively?arrow_forward$5,000 received each year for five years on the first day of each year if your investments pay 6 percent compounded annually. $5,000 received each quarter for five years on the first day of each quarter if your investments pay 6 percent compounded quarterly. Can you show me either by hand or using a financial calculator please.arrow_forward
- Can you solve these questions on a financial calculator: $5,000 received each year for five years on the last day of each year if your investments pay 6 percent compounded annually. $5,000 received each quarter for five years on the last day of each quarter if your investments pay 6 percent compounded quarterly.arrow_forwardNow suppose Elijah offers a discount on subsequent rooms for each house, such that he charges $40 for his frist room, $35 for his second, and $25 for each room thereafter. Assume 30% of his clients have only one room cleaned, 25% have two rooms cleaned, 30% have three rooms cleaned, and the remaining 15% have four rooms cleaned. How many houses will he have to clean before breaking even? If taxes are 25% of profits, how many rooms will he have to clean before making $15,000 profit? Answer the question by making a CVP worksheet similar to the depreciation sheets. Make sure it works well, uses cell references and functions/formulas when appropriate, and looks nice.arrow_forward1. Answer the following and cite references. • what is the whole overview of Green Markets (Regional or Sectoral Stock Markets)? • what is the green energy equities, green bonds, and green financing and how is this related in Green Markets (Regional or Sectoral Stock Markets)? Give a detailed explanation of each of them.arrow_forward
- Could you help explain “How an exploratory case study could be goodness of work that is pleasing to the Lord?”arrow_forwardWhat are the case study types and could you help explain and make an applicable example.What are the 4 primary case study designs/structures (formats)?arrow_forwardThe Fortune Company is considering a new investment. Financial projections for the investment are tabulated below. The corporate tax rate is 24 percent. Assume all sales revenue is received in cash, all operating costs and income taxes are paid in cash, and all cash flows occur at the end of the year. All net working capital is recovered at the end of the project. Year 0 Year 1 Year 2 Year 3 Year 4 Investment $ 28,000 Sales revenue $ 14,500 $ 15,000 $ 15,500 $ 12,500 Operating costs 3,100 3,200 3,300 2,500 Depreciation 7,000 7,000 7,000 7,000 Net working capital spending 340 390 440 340 ?arrow_forward
arrow_back_ios
SEE MORE QUESTIONS
arrow_forward_ios
Recommended textbooks for you
 Essentials Of InvestmentsFinanceISBN:9781260013924Author:Bodie, Zvi, Kane, Alex, MARCUS, Alan J.Publisher:Mcgraw-hill Education,

 Foundations Of FinanceFinanceISBN:9780134897264Author:KEOWN, Arthur J., Martin, John D., PETTY, J. WilliamPublisher:Pearson,
 Fundamentals of Financial Management (MindTap Cou...FinanceISBN:9781337395250Author:Eugene F. Brigham, Joel F. HoustonPublisher:Cengage Learning
 Corporate Finance (The Mcgraw-hill/Irwin Series i...FinanceISBN:9780077861759Author:Stephen A. Ross Franco Modigliani Professor of Financial Economics Professor, Randolph W Westerfield Robert R. Dockson Deans Chair in Bus. Admin., Jeffrey Jaffe, Bradford D Jordan ProfessorPublisher:McGraw-Hill Education

Essentials Of Investments
Finance
ISBN:9781260013924
Author:Bodie, Zvi, Kane, Alex, MARCUS, Alan J.
Publisher:Mcgraw-hill Education,


Foundations Of Finance
Finance
ISBN:9780134897264
Author:KEOWN, Arthur J., Martin, John D., PETTY, J. William
Publisher:Pearson,

Fundamentals of Financial Management (MindTap Cou...
Finance
ISBN:9781337395250
Author:Eugene F. Brigham, Joel F. Houston
Publisher:Cengage Learning

Corporate Finance (The Mcgraw-hill/Irwin Series i...
Finance
ISBN:9780077861759
Author:Stephen A. Ross Franco Modigliani Professor of Financial Economics Professor, Randolph W Westerfield Robert R. Dockson Deans Chair in Bus. Admin., Jeffrey Jaffe, Bradford D Jordan Professor
Publisher:McGraw-Hill Education
Chapter 8 Risk and Return; Author: Michael Nugent;https://www.youtube.com/watch?v=7n0ciQ54VAI;License: Standard Youtube License