
Concept explainers
(a)
The maximum queue length that will be formed, total delay, number of vehicles that will be affected by the incident, the average individual delay for the expected demand flow of 70%of the capacity of the highway.
Answer to Problem 20P
For 70 % expected demand flow:
Themaximum queue length that will be formed is
The total delay is
The number of vehicles that will be affected by the incident is
The average individual delay is
Explanation of Solution
Given:
We have been given the following information:
Total number of lanes = 3,
Mean free flow speed of the highway
Jam density
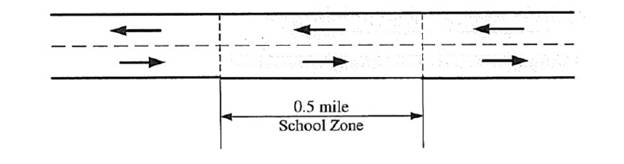
Following is the lay out of the given highway section:

Calculation:
For the expected 70 % demand flow:
We have the following formula for the determination of maximum queue length that will be formed:
Where,
Considering 70 percent of the flow and that the capacity of each lane is 2000 Veh/ h
Substituting the values in the following equation, we have
The maximum queue length that will be formed is
Now, the total delay, we have the following formula
Where,
And C is the total capacity and can be found as
Now, substituting the values in the required equation, we have
The total delay is
The number of vehicles that will be affected by the incident.
To calculate the number of vehicles that will be affected by the incident can be found using the following formula:
Number of vehicles affected =
Substituting the values, we have
The number of vehicles that will be affected by the incident is
To calculate the average individual delay, we have the following formula:
Average individual delay
Substituting the values, we have
The average individual delay is
Conclusion:
Therefore, for 70 % expected demand flow:
Themaximum queue length that will be formed is
The number of vehicles that will be affected by the incident is
(b)
The maximum queue length that will be formed, total delay, number of vehicles that will be affected by the incident, the average individual delay for the expected demand flow of 75%of the capacity of the highway.
Answer to Problem 20P
For 75 % expected demand flow:
Themaximum queue length that will be formed is
The total delay is
The number of vehicles that will be affected by the incident is
The average individual delay is
Explanation of Solution
Given:
We have been given the following information:
Total number of lanes = 3,
Mean free flow speed of the highway
Jam density
Following is the lay out of the given highway section:

Calculation:
For the expected 75 % demand flow:
We have the following formula for the determination of maximum queue length that will be formed:
Where,
Considering 75 percent of the flow and that the capacity of each lane is 2000 Veh/ h
Substituting the values in the following equation, we have
Themaximum queue length that will be formed is
Now, the total delay, we have the following formula
Where,
And C is the total capacity and can be found as
Now, substituting the values in the required equation, we have
The total delay is
The number of vehicles that will be affected by the incident.
To calculate the number of vehicles that will be affected by the incident can be found using the following formula:
Number of vehicles affected =
Substituting the values, we have
The number of vehicles that will be affected by the incident is
To calculate the average individual delay, we have the following formula:
Average individual delay
Substituting the values, we have
The average individual delay is
Conclusion:
For 75 % expected demand flow:
Themaximum queue length that will be formed is
(c)
The maximum queue length that will be formed, total delay, number of vehicles that will be affected by the incident, the average individual delay for the expected demand flow of 80% of the capacity of the highway.
Answer to Problem 20P
For 80 % expected demand flow:
Themaximum queue length that will be formed is
The total delay is
The number of vehicles that will be affected by the incident is
The average individual delay is
Explanation of Solution
Given:
We have been given the following information:
Total number of lanes = 3,
Mean free flow speed of the highway
Jam density
Following is the lay out of the given highway section:

Calculation:
For the expected 80 % demand flow:
We have the following formula for the determination of maximum queue length that will be formed:
Where,
Considering 80 percent of the flow and that the capacity of each lane is 2000 Veh/ h
Substituting the values in the following equation, we have
The maximum queue length that will be formed is
Now, the total delay, we have the following formula
Where,
And C is the total capacity and can be found as
Now, substituting the values in the required equation, we have
The total delay is
The number of vehicles that will be affected by the incident.
To calculate the number of vehicles that will be affected by the incident can be found using the following formula:
Number of vehicles affected =
Substituting the values, we have
Therefore, the number of vehicles that will be affected by the incident is
To calculate the average individual delay, we have the following formula:
Average individual delay
Substituting the values, we have
The average individual delay is
Conclusion:
For 80 % expected demand flow:
Themaximum queue length that will be formed is
the average individual delay is
(d)
The maximum queue length that will be formed, total delay, number of vehicles that will be affected by the incident, the average individual delay for the expected demand flowof 85% of the capacity of the highway.
Answer to Problem 20P
For 85 % expected demand flow:
Themaximum queue length that will be formed is
The total delay is
The number of vehicles that will be affected by the incident is
The average individual delay is
Explanation of Solution
Given:
We have been given the following information:
Total number of lanes = 3,
Mean free flow speed of the highway
Jam density
Following is the lay out of the given highway section:
Calculation:
For the expected 85 % demand flow:
We have the following formula for the determination of maximum queue length that will be formed:
Where,
Considering 85 percent of the flow and that the capacity of each lane is 2000 Veh/ h
Substituting the values in the following equation, we have
Therefore, the maximum queue length that will be formed is
Now, the total delay, we have the following formula
Where,
And C is the total capacity and can be found as
Now, substituting the values in the required equation, we have
Therefore, the total delay is
The number of vehicles that will be affected by the incident.
To calculate the number of vehicles that will be affected by the incident can be found using the following formula:
Number of vehicles affected =
Substituting the values, we have
The number of vehicles that will be affected by the incident is
To calculate the average individual delay, we have the following formula:
Average individual delay
Substituting the values, we have
the average individual delay is
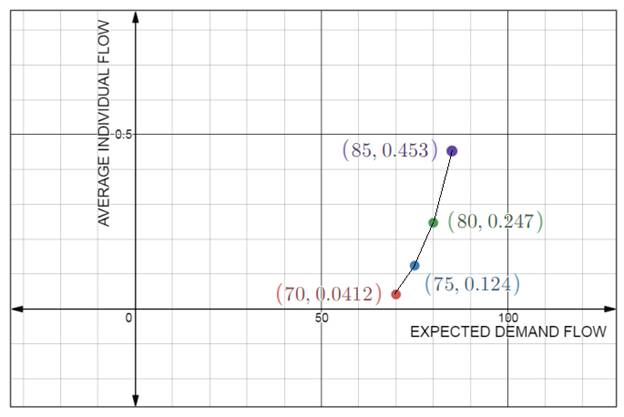
The graph of average individual delay versus the expected demand flow is as follows:
Conclusion:
For 85 % expected demand flow:
Themaximum queue length that will be formed is
the average individual delay is
Want to see more full solutions like this?
Chapter 6 Solutions
Traffic and Highway Engineering


- For the truss shown in Fig 2, determine the nodal displacement and member forces for all elements of the truss. Assume for each member A = 0.0015 m2 and E = 200 GPa please show all working, relevant FBD's and use ID's indicated in the diagram, if using an alpha numerical in equations please indicate where it is being applied to in the truss.arrow_forwardDetermine the global stiffness matrix of the beam shown in Fig. 3. Assume supports at 1 and 3 are rollers and the support at 2 is a pinned support. Indicate the degrees of freedom in all the stiffness matrices. EI is constant, w=60kN/m, L1=1.25m and L2=3.45m please explain how the code numbers for global matrix are determined in detailarrow_forward= 20 kips = 20 kips B w₁ = 2 kips/ft 20" 12'- 7760 12" 6"arrow_forward
- In the figure, all loads are factored, and the uniform load includes self-weight. Use #3stirrups. fc′ = 4 ksi, and fy = 75 ksi.(a) What stirrup spacing is required at section A?(b) How will this spacing change at section B?(c) Indicate the region of the beam where stirrups are not required.arrow_forwardFluid mechanics question Draw a free body diagram and properly explain each starrow_forwardThe box beam in the figure is reinforced with #4 U-stirrups in each web. f c′ = 3.5 ksi, andfy = 60 ksi.(a) What is the design shear capacity of the cross section?Hint: Find concrete and stirrup strengths separately, and then find the total capacity.(b) If the total applied factored shear force at the section is 220 kip, please comment onthe adequacy of this shear design.Hint: Compare the total capacity from (b) with the shear force.2. In the figure, all loads are factored, and the uniform load includes self-weight. Use #3stirrups. fc′ = 4 ksi, and fy = 75 ksi.(a) What stirrup spacing is required at section A?(b) How will this spacing change at section B?(c) Indicate the region of the beam where stirrups are not required.arrow_forward
- Structural analysis questionarrow_forward1) Assuming that water at 20 C is flowing through the system at a constant flow rate of 2 ft³/sec and neglecting viscous effects, calculate the EL and HGL at points A, B, and C. Sketch the EL and HGL alongside the diagram. A ZA = 55 ft D₁ = 3 in B D₂ = 6 in C 2) What is the elevation at point C in the above figure? 3) Using the figure from problem 1, sketch the EL and HGL accounting for both major and minor losses. Note that the flow rate will change due to the introduction of friction (we will explore this further in the coming weeks). You do not need to calculate the values of EL and HGL.arrow_forward8) Carbon dioxide at 20 C is transported through a pipe of 0.1 m in diameter. What is the maximum flow rate possible to achieve laminar flow?arrow_forward
 Traffic and Highway EngineeringCivil EngineeringISBN:9781305156241Author:Garber, Nicholas J.Publisher:Cengage Learning