Concept explainers
Videos
Three recessive traits in garden pea plants are as follows: yellow pods are recessive to green pods, bluish green seedlings are recessive to green seedlings, creeper (a plant that cannot stand up) is recessive to normal. A true-breeding normal plant with green pods and green seedlings was crossed to a creeper with yellow pods and bluish green seedlings. The
2059 green pods, green seedlings, normal
151 green pods, green seedlings, creeper
281 green pods, bluish green seedlings, normal
15 green pods, bluish green seedlings, creeper
2041 yellow pods, bluish green seedlings, creeper
157 yellow pods, bluish green seedlings, normal
282 yellow pods, green seedlings, creeper
11 yellow pods, green seedlings, normal
Construct a genetic map that indicates the map distances between these three genes.
To review:
A genetic map indicating map distances between the genes for pod color, seedling color, and plant stature.
Introduction:
Thepair of alleles ofa gene determines the protein encoded by the genes, and results in the phenotype of the trait. True breeders have the monomorphic condition for the alleles of a trait. A genetic map helps in describing the arrangement of the genes on a particular chromosome.
Explanation of Solution
A normal pea plant, which is truebreeding for green seedling and green pods is crossed with a creeper pea plant, having bluish-green seedlings and yellow pods. The F1 offspring are then crossed with a creeper having bluish-green seedlings and yellow pods.
Different characters of the pea plant can be denoted as follows:
Dominant characters: G for green pods, S for green seedling, and C for normal plants
Recessive characters: g for yellow pods, s for bluish green seedlings, and c for the creeper.
Given, the true breeding normal plant, having green seedlings as well as green pods is crossed with true breeding creeper, having bluish green seedling and yellow pods. The genotype of true breeding plants is GGSSCC and ggsscc. Thus, the gametes will be GSC and gsc. The plants in the F1 generation obtained by crossing these true breeders will be GgSsCc.
When three genes are linked then G, S, and C alleles will be linked together whereas g, s, and c alleles will be linked together, on a homologous chromosome. Given, the F1 plants GgSsCc are crossed with ggsscc (creepers having yellow pods and bluish green seedlings) and following results were obtained:
| Number of plants | Phenotype |
| 2059 | Green pods, green seedlings, normal |
| 151 | Green pods, green seedlings, creepers |
| 281 | Green pods, bluish green seedlings, normal |
| 15 | Green pods, bluish green seedlings, creepers |
| 2041 | Yellow pods, bluish green seedlings, creepers |
| 157 | Yellow pods, bluish green seedlings, normal |
| 282 | Yellow pods, green seedlings, creepers |
| 11 | Yellow pods, green seedlings, normal |
The genetic map for the three genes can be constructed by using the below-mentioned formula for map distance:
The distance between the three genes can be measured by separating the data of the offspring and phenotypic categories into gene pair, and then calculating the map distance between the two genes.
For the map distance between the genes for plant stature and pod color,
the number of offsprings is calculated for each pair of plant stature and color of pods.
Non-recombinant offspring are 2340 normal, green pods, and 2323 creeper, yellow pods.
Recombinant offspring are 166 creeper, green pods, and 168 normal, yellow pods.
Therefore, the map distance will be calculated as,
For the map distance between the genes for plant stature and seedling color, the number of offspring having genes for plant stature and color of the seedlingis given as follows:
Nonrecombinant offspring are 2070 normal, green seedlings, and 2056 creeper, bluish green seedlings, and the recombinant offspring are 433 creeper, green seedlings, and 438 normal, bluish green seedlings.
Therefore, the map distance will be calculated as.
For the map distance between the genes for seedling color and pod color, the number of offspring having genes for the color of seedling and pods is given as follows:
Non-recombinant offspring are 2210 green seedling, green pods, and 2198 bluish green seedling, yellow pods, and the recombinant offspring are 296 bluish green seedling, green pods, and 293 green seedling, yellow pods.Therefore, the map distance will be calculated as,
Thus, the distance between the genes for seedling and pods colors is 11.8 mu, and that between the genes for plant stature and seedling color is 17.4 mu and for the genes for plant stature and pod color, it is 6.7 mu. Therefore, the order of the three genes, according to the map distance in-between them will be seedling color, pod color, plant stature. Gene for pod color is present in the middle. Genetic map is shown below:
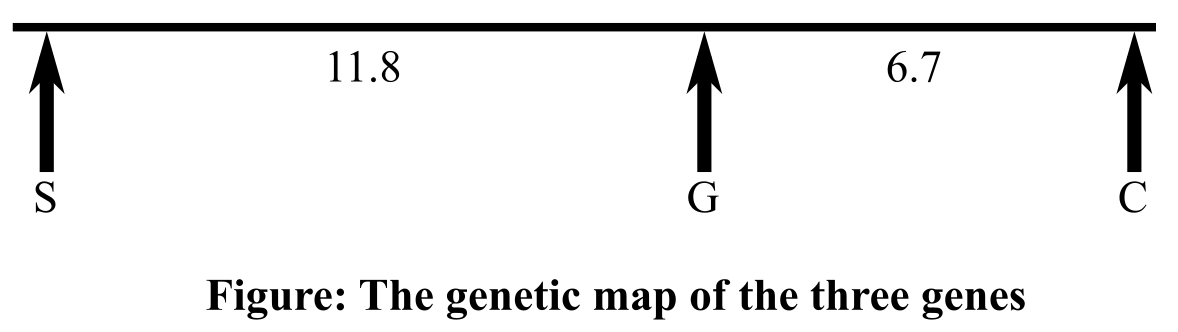
Therefore, it can be concluded that according to the map distance calculated in-between the genes for pod color, plant stature, and seedling color, the order of the three genes will be seedling color, pod color, plant stature(or the opposite order). The distance between the genes responsible for seedling and pods colors is 11.8 mu, and between the genes for plant stature and pod color, it is 6.7 mu. The genes that code for plant stature and seedling color are 17.4 mu apart.
Want to see more full solutions like this?
Chapter 6 Solutions
GENETICS:ANALYSIS+PRIN.(LL)-W/ACCESS


- If you had an unknown microbe, what steps would you take to determine what type of microbe (e.g., fungi, bacteria, virus) it is? Are there particular characteristics you would search for? Explain.arrow_forwardavorite Contact avorite Contact favorite Contact ୫ Recant Contacts Keypad Messages Pairing ง 107.5 NE Controls Media Apps Radio Nav Phone SCREEN OFF Safari File Edit View History Bookmarks Window Help newconnect.mheducation.com M Sign in... S The Im... QFri May 9 9:23 PM w The Im... My first.... Topic: Mi Kimberl M Yeast F Connection lost! You are not connected to internet Sigh in... Sign in... The Im... S Workin... The Im. INTRODUCTION LABORATORY SIMULATION Tube 1 Fructose) esc - X Tube 2 (Glucose) Tube 3 (Sucrose) Tube 4 (Starch) Tube 5 (Water) CO₂ Bubble Height (mm) How to Measure 92 3 5 6 METHODS RESET #3 W E 80 A S D 9 02 1 2 3 5 2 MY NOTES LAB DATA SHOW LABELS % 5 T M dtv 96 J: ப 27 כ 00 alt A DII FB G H J K PHASE 4: Measure gas bubble Complete the following steps: Select ruler and place next to tube 1. Measure starting height of gas bubble in respirometer 1. Record in Lab Data Repeat measurement for tubes 2-5 by selecting ruler and move next to each tube. Record each in Lab Data…arrow_forwardCh.23 How is Salmonella able to cross from the intestines into the blood? A. it is so small that it can squeeze between intestinal cells B. it secretes a toxin that induces its uptake into intestinal epithelial cells C. it secretes enzymes that create perforations in the intestine D. it can get into the blood only if the bacteria are deposited directly there, that is, through a puncture — Which virus is associated with liver cancer? A. hepatitis A B. hepatitis B C. hepatitis C D. both hepatitis B and C — explain your answer thoroughlyarrow_forward
- Ch.21 What causes patients infected with the yellow fever virus to turn yellow (jaundice)? A. low blood pressure and anemia B. excess leukocytes C. alteration of skin pigments D. liver damage in final stage of disease — What is the advantage for malarial parasites to grow and replicate in red blood cells? A. able to spread quickly B. able to avoid immune detection C. low oxygen environment for growth D. cooler area of the body for growth — Which microbe does not live part of its lifecycle outside humans? A. Toxoplasma gondii B. Cytomegalovirus C. Francisella tularensis D. Plasmodium falciparum — explain your answer thoroughlyarrow_forwardCh.22 Streptococcus pneumoniae has a capsule to protect it from killing by alveolar macrophages, which kill bacteria by… A. cytokines B. antibodies C. complement D. phagocytosis — What fact about the influenza virus allows the dramatic antigenic shift that generates novel strains? A. very large size B. enveloped C. segmented genome D. over 100 genes — explain your answer thoroughlyarrow_forwardWhat is this?arrow_forward
- Molecular Biology A-C components of the question are corresponding to attached image labeled 1. D component of the question is corresponding to attached image labeled 2. For a eukaryotic mRNA, the sequences is as follows where AUGrepresents the start codon, the yellow is the Kozak sequence and (XXX) just represents any codonfor an amino acid (no stop codons here). G-cap and polyA tail are not shown A. How long is the peptide produced?B. What is the function (a sentence) of the UAA highlighted in blue?C. If the sequence highlighted in blue were changed from UAA to UAG, how would that affecttranslation? D. (1) The sequence highlighted in yellow above is moved to a new position indicated below. Howwould that affect translation? (2) How long would be the protein produced from this new mRNA? Thank youarrow_forwardMolecular Biology Question Explain why the cell doesn’t need 61 tRNAs (one for each codon). Please help. Thank youarrow_forwardMolecular Biology You discover a disease causing mutation (indicated by the arrow) that alters splicing of its mRNA. This mutation (a base substitution in the splicing sequence) eliminates a 3’ splice site resulting in the inclusion of the second intron (I2) in the final mRNA. We are going to pretend that this intron is short having only 15 nucleotides (most introns are much longer so this is just to make things simple) with the following sequence shown below in bold. The ( ) indicate the reading frames in the exons; the included intron 2 sequences are in bold. A. Would you expected this change to be harmful? ExplainB. If you were to do gene therapy to fix this problem, briefly explain what type of gene therapy youwould use to correct this. Please help. Thank youarrow_forward
- Molecular Biology Question Please help. Thank you Explain what is meant by the term “defective virus.” Explain how a defective virus is able to replicate.arrow_forwardMolecular Biology Explain why changing the codon GGG to GGA should not be harmful. Please help . Thank youarrow_forwardStage Percent Time in Hours Interphase .60 14.4 Prophase .20 4.8 Metaphase .10 2.4 Anaphase .06 1.44 Telophase .03 .72 Cytukinesis .01 .24 Can you summarize the results in the chart and explain which phases are faster and why the slower ones are slow?arrow_forward
 Concepts of BiologyBiologyISBN:9781938168116Author:Samantha Fowler, Rebecca Roush, James WisePublisher:OpenStax College
 Human Heredity: Principles and Issues (MindTap Co...BiologyISBN:9781305251052Author:Michael CummingsPublisher:Cengage Learning
 Human Biology (MindTap Course List)BiologyISBN:9781305112100Author:Cecie Starr, Beverly McMillanPublisher:Cengage Learning
 Biology: The Dynamic Science (MindTap Course List)BiologyISBN:9781305389892Author:Peter J. Russell, Paul E. Hertz, Beverly McMillanPublisher:Cengage Learning
 Biology (MindTap Course List)BiologyISBN:9781337392938Author:Eldra Solomon, Charles Martin, Diana W. Martin, Linda R. BergPublisher:Cengage Learning
 Biology 2eBiologyISBN:9781947172517Author:Matthew Douglas, Jung Choi, Mary Ann ClarkPublisher:OpenStax