Concept explainers
Videos
Social Networking The data in the table below represent the percent of U.S. citizens aged 12 and older who have a profile on at least one social network.
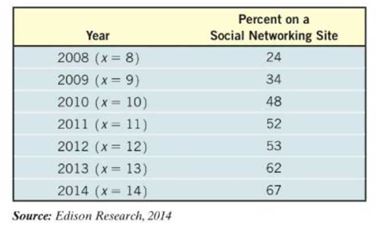
(a) Using a graphing utility, draw a
(b) Using a graphing utility, build a logarithmic model from the data.
(c) Graph the logarithmic function found in part (b) on the scatter diagram.
(d) Use the model to predict the percent of U.S. citizens on social networking sites in 2015.
(e) Use the model to predict the year in which of U.S. citizens will be on social networking sites.
Want to see the full answer?
Check out a sample textbook solution
Chapter 5 Solutions
Precalculus Enhanced with Graphing Utilities Plus MyLab Math with Pearson eText - Access Card Package (7th Edition) (Sullivan & Sullivan Precalculus Titles)


 Glencoe Algebra 1, Student Edition, 9780079039897...AlgebraISBN:9780079039897Author:CarterPublisher:McGraw Hill
 Big Ideas Math A Bridge To Success Algebra 1: Stu...AlgebraISBN:9781680331141Author:HOUGHTON MIFFLIN HARCOURTPublisher:Houghton Mifflin Harcourt
 College Algebra (MindTap Course List)AlgebraISBN:9781305652231Author:R. David Gustafson, Jeff HughesPublisher:Cengage Learning
 Elementary AlgebraAlgebraISBN:9780998625713Author:Lynn Marecek, MaryAnne Anthony-SmithPublisher:OpenStax - Rice University
 Algebra and Trigonometry (MindTap Course List)AlgebraISBN:9781305071742Author:James Stewart, Lothar Redlin, Saleem WatsonPublisher:Cengage Learning