Concept explainers
Videos
Population composition. The number of children in a large city was found to increase and then decrease rather drastically. If the number of children (in millions) over a 6-year period was given by
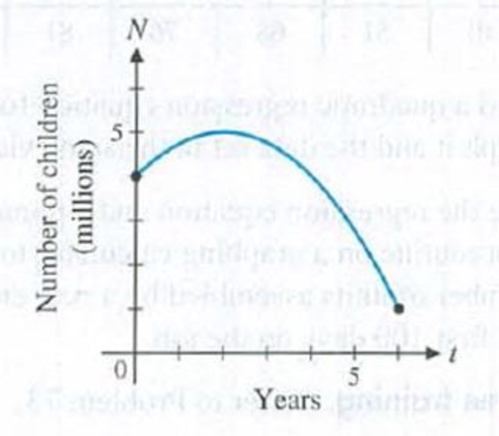
what was the average number of children in the city over the 6-year period? [Assume that N = A′(t) is continuous.]
Want to see the full answer?
Check out a sample textbook solution
Chapter 5 Solutions
Calculus for Business Economics Life Sciences and Social Sciences Plus NEW


- Select all solids for which the formula V = Bh applies. A. a triangular prism B. a triangular pyramid C. a square pyramid D. a rectangular prism E. a cone F. a cylinderarrow_forward1. For the following subsets of R3, explain whether or not they are a subspace of R³. (a) (b) 1.1 0.65 U = span -3.4 0.23 0.4 -0.44 0 (})} a V {(2) | ER (c) Z= the points in the z-axisarrow_forwardShow that i cote +1 = cosec 20 tan 20+1 = sec² O २ cos² + sin 20 = 1 using pythagon's theoremarrow_forward
- This is my h/w ,Required to find the region of shaded sector ,I don't really know how to deal with this tasks ,so if someone could help me to understand them it would be awesome,and sorry for my poor Englisharrow_forwardThe U.S. Postal Service will ship a Priority Mail® Large Flat Rate Box (12" 3 12" 3 5½") any where in the United States for a fixed price, regardless of weight. The weights (ounces) of 20 ran domly chosen boxes are shown below. (a) Make a stem-and-leaf diagram. (b) Make a histogram. (c) Describe the shape of the distribution. Weights 72 86 28 67 64 65 45 86 31 32 39 92 90 91 84 62 80 74 63 86arrow_forward(a) What is a bimodal histogram? (b) Explain the difference between left-skewed, symmetric, and right-skewed histograms. (c) What is an outlierarrow_forward
- △DEF△DEF has vertices D(0, 2) and F(6, 2). If △DEF△DEF has an area of 12 square units, select all the possible coordinates for E.arrow_forward2. In a computer network some pairs of computers are connected by network cables. Your goal is to set up the computers so that messages can be sent quickly from any computer to any other computer. For this you have identified each of the n com- puters uniquely with a number between 1 and n, and have decided that a message should consist of two such numbers, identifying the sender and the recipient, fol- lowed by the content of the message. As cables are relatively short, you can assume that sending a message across a single cable takes an amount of time that is the same irrespective of the length of the cable. You can further assume that at most one message travels between computer at any point, so that you don't have to worry about inference among messages. (a) Define a graph or network that models the computer network and allows you to answer the remaining parts of this question. (b) Consider two computers, a sender and a recipient. Using the graph or network you have defined,…arrow_forward3. A spreadsheet consists of cells indexed by a row and a column. Each cell contains either a value or a formula that depends on the values of other cells. (a) Describe a graph, digraph, or network that models an arbitrary spreadsheet and allows you to answer the remaining parts of this question. (b) Explain, by referring to the graph, digraph, or network, when it is possible to change the value of cell x without changing the value of cell y. (c) Explain, by referring to the graph, digraph, or network, when it is possible to calculate the values of all cells in the spreadsheet. Consider the following spreadsheet with 5 rows, 7 columns, and 35 cells. For exam- ple, cell el contains a value, whereas cell al contains a formula that depends on the values cells el and 95. a b с 1 el+g5 al-c5 110 d al+cl 180 e f g f5-el c1+c2 2 al+b1 a2+c4 240 a2+c2 120 f5-e2 e3+e5 3 a2+b2 a3-c3 100 a3+c1 200 f5-e3 f1+f2 4 a3+b3 a4+c2 220 a4+c2 100 f5-e4 f3+f4 5 a4+b4 a5-c1 130 a5+c5 120 g3+g4 g1+g2 (d) Can…arrow_forward
- 1. Let W, U, and S be graphs defined as follows: • V(W) is the set of countries in the world; • V(U) is the set of countries in the European Union; V(S) is the set of countries in the Schengen Area; ● for X = {W,U,S}, E(X) is the set of pairs of countries in V(X) that share a land border. Recall that land borders between countries in the Schengen Area are special in that they can be crossed without a passport. (a) The notions of a country and a land border are somewhat ambiguous. Explain the notions you will use to get a precise definition of the graphs W, U, and S. (b) Is S a subgraph of U? Is U an induced subgraph of W? Justify your answers. (c) Using non-mathematical language, explain what it means for a country x if VEV(S) and dw (v) = 0. Give all such countries. Let A = {v Є V(W) \V(S) such that |Nw(v)| > 0 and Nw (v) ≤ V(S)}. (d) Using non-mathematical language, explain what the set A represents in terms of countries and land borders. Give a specific element of A or explain why A…arrow_forward3. A spreadsheet consists of cells indexed by a row and a column. Each cell contains either a value or a formula that depends on the values of other cells. (a) Describe a graph, digraph, or network that models an arbitrary spreadsheet and allows you to answer the remaining parts of this question. (b) Explain, by referring to the graph, digraph, or network, when it is possible to change the value of cell x without changing the value of cell y. (c) Explain, by referring to the graph, digraph, or network, when it is possible to calculate the values of all cells in the spreadsheet. Consider the following spreadsheet with 5 rows, 7 columns, and 35 cells. For exam- ple, cell el contains a value, whereas cell al contains a formula that depends on the values cells el and 95. a b с d e f g 1 el+g5 al-c5 110 al+cl 180 f5-el c1+c2 2 al+bl a2+c4 240 a2+c2 120 f5-e2 e3+e5 3 a2+b2 a3-c3 100 a3+c1 200 f5-e3 f1+f2 4 a3+b3 a4+c2 220 a4+c2 100 f5-e4 f3+f4 5 a4+b4 a5-c1 130 a5+c5 120 g3+g4 gl+g2 (d) Can…arrow_forwardt 56 65 33arrow_forward
 Algebra & Trigonometry with Analytic GeometryAlgebraISBN:9781133382119Author:SwokowskiPublisher:Cengage
 Algebra and Trigonometry (MindTap Course List)AlgebraISBN:9781305071742Author:James Stewart, Lothar Redlin, Saleem WatsonPublisher:Cengage Learning
 Big Ideas Math A Bridge To Success Algebra 1: Stu...AlgebraISBN:9781680331141Author:HOUGHTON MIFFLIN HARCOURTPublisher:Houghton Mifflin Harcourt
 College AlgebraAlgebraISBN:9781305115545Author:James Stewart, Lothar Redlin, Saleem WatsonPublisher:Cengage Learning
 Linear Algebra: A Modern IntroductionAlgebraISBN:9781285463247Author:David PoolePublisher:Cengage Learning