
Concept explainers
Videos
The bar graphs show U. S. film box-office receipts, in millions of dollars, and box-office admissions, in millions of tickets sold, for five selected years.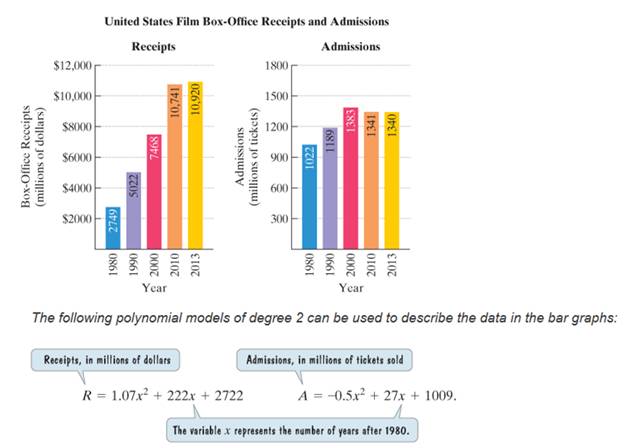
Use the information and a calculator to solve exercises 87-88.
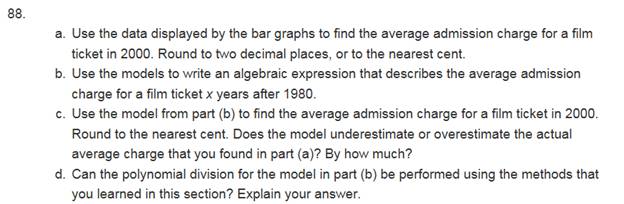
88.
a. Use the data displayed by the bar graphs to find the average admission charge for a film ticket in 2000. Round to two decimal places, or to the nearest cent.
b. Use the models to write an algebraic expression that describes the average admission charge for a film ticket x years after 1980.
c. Use the model from part (b) to find the average admission charge for a film ticket in 2000. Round to the nearest cent. Does the model underestimate or overestimate the actual average charge that you found in part (a)? By how much?
d. Can the polynomial division for the model in part (b) be performed using the methods that you learned in this section? Explain your answer.
Want to see the full answer?
Check out a sample textbook solution
Chapter 5 Solutions
Introductory Algebra for College Students (7th Edition)


- Calculați (a-2023×b)²⁰²⁴arrow_forwardA student completed the problem below. Identify whether the student was correct or incorrect. Explain your reasoning. (identification 1 point; explanation 1 point) 4x 3x (x+7)(x+5)(x+7)(x-3) 4x (x-3) (x+7)(x+5) (x03) 3x (x+5) (x+7) (x-3)(x+5) 4x²-12x-3x²-15x (x+7) (x+5) (x-3) 2 × - 27x (x+7)(x+5) (x-3)arrow_forward2 Add the rational expressions below. Can you add them in this original form? Explain why or why not. 3x-7 5x + x² - 7x+12 4x-12 Show all steps. State your least common denominator and explain in words your process on how you determined your least common denominator. Be sure to state your claim, provide your evidence, and provide your reasoning before submitting.arrow_forward
- carol mailed a gift box to her sister the boxed gift weighed a total of 2 pounds the box alone weighed 13 ounces what was the wright of the giftarrow_forwardDirections: Use the table below to answer the following questions and show all work. Heights of Females 50.0 51.5 53.0 53.5 54.0 1. What is the average female height? 2. What are all the differences from the mean? 3. What is the variance for the female heights? 4. What is the standard deviation of the heights of the females? 5. What does the standard deviation found in number 4 represent? Write your answer in complete sentences.arrow_forward135 metr uzunlikdagi simni 6:3 nisbatda qismlarga am eatingarrow_forward
- MODELING REAL LIFE Your checking account has a constant balance of $500. Let the function $m$ represent the balance of your savings account after $t$ years. The table shows the total balance of the accounts over time. Year, $t$ Total balance 0 1 2 3 4 5 $2500 $2540 $2580.80 $2622.42 $2664.86 $2708.16 a. Write a function $B$ that represents the total balance after $t$ years. Round values to the nearest hundredth, if necessary. $B\left(t\right)=$ Question 2 b. Find $B\left(8\right)$ . About $ a Question 3 Interpret $B\left(8\right)$ . b represents the total balance checking and saving accounts after 8 years the balance would be 16 / 10000 Word Limit16 words written of 10000 allowed Question 4 c. Compare the savings account to the account, You deposit $9000 in a savings account that earns 3.6% annual interest compounded monthly. A = 11998.70 SINCE 9000 is the principal ( 1+0.036/12)12 times 8 gives me aproxtimately 1997 14 / 10000 Word Limit14 words written of 10000 allowed Skip to…arrow_forwardListen MODELING REAL LIFE Your checking account has a constant balance of $500. Let the function m represent the balance of your savings account after t years. The table shows the total balance of the accounts over time. Year, t Total balance 0 $2500 1 $2540 2 $2580.80 3 $2622.42 4 $2664.86 5 $2708.16 a. Write a function B that represents the total balance after t years. Round values to the nearest hundredth, if necessary. B(t) = 500 + 2000(1.02)* b. Find B(8). About $2843.32 Interpret B(8). B I U E T² T₂ c. Compare the savings account to the account, You deposit $9000 in a savings account that earns 3.6% annual interest compounded monthly. B I U E E T² T₂ A = 11998.70 SINCE 9000 is the principal (1+0.036/12)12 times 8 gives me aproxtimately 1997arrow_forwardWhat are the answers for star powerarrow_forward
 Holt Mcdougal Larson Pre-algebra: Student Edition...AlgebraISBN:9780547587776Author:HOLT MCDOUGALPublisher:HOLT MCDOUGAL
 Glencoe Algebra 1, Student Edition, 9780079039897...AlgebraISBN:9780079039897Author:CarterPublisher:McGraw Hill
 Big Ideas Math A Bridge To Success Algebra 1: Stu...AlgebraISBN:9781680331141Author:HOUGHTON MIFFLIN HARCOURTPublisher:Houghton Mifflin Harcourt
 College AlgebraAlgebraISBN:9781305115545Author:James Stewart, Lothar Redlin, Saleem WatsonPublisher:Cengage Learning
 College Algebra (MindTap Course List)AlgebraISBN:9781305652231Author:R. David Gustafson, Jeff HughesPublisher:Cengage Learning