
Concept explainers
Videos
The bar graphs show U. S. film box-office receipts, in millions of dollars, and box-office admissions, in millions of tickets sold, for five selected years.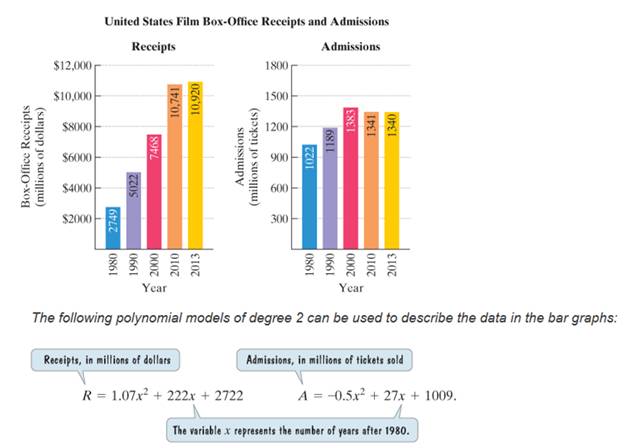
Use the information and a calculator to solve exercises 87-88.
87.
a. use the data displayed by the bar graphs to find the average admission charge for a film ticket in 1990. Round to two decimal places, or to the nearest cent.
b. use the models to write an algebraic expression that describes the average admission charge for a film ticket x years after 1980.
c. use the model from part (b) to find the average admission charge for a film ticket in 1990. Round to the nearest cent. Does the model underestimate or overestimate the actual average charge that you found in part (a)? By how much?
d. Can the polynomial division for the model in part (b) be performed using the methods that you learned in this section? Explain your answer.
Want to see the full answer?
Check out a sample textbook solution
Chapter 5 Solutions
Introductory Algebra for College Students (7th Edition)


- Kate, Luke, Mary and Nancy are sharing a cake. The cake had previously been divided into four slices (s1, s2, s3 and s4). The following table shows the values of the slices in the eyes of each player. What is fair share to nancy? S1 S2 S3 S4 Kate $4.00 $6.00 $6.00 $4.00 Luke $5.30 $5.00 $5.25 $5.45 Mary $4.25 $4.50 $3.50 $3.75 Nancy $6.00 $4.00 $4.00 $6.00arrow_forwardKate, Luke, Mary and Nancy are sharing a cake. The cake had previously been divided into four slices (s1, s2, s3 and s4). The following table shows the values of the slices in the eyes of each player. S1 S2 S3 S4 Kate $4.00 $6.00 $6.00 $4.00 Luke $5.30 $5.00 $5.25 $5.45 Mary $4.25 $4.50 $3.50 $3.75 Nancy $6.00 $4.00 $4.00 $6.00 how much is the cak worth to maryarrow_forwardKate, Luke, Mary and Nancy are sharing a cake. The cake had previously been divided into four slices (s1, s2, s3 and s4). The following table shows the values of the slices in the eyes of each player. What is the threshold of fair share for Luke? S1 S2 S3 S4 Kate $4.00 $6.00 $6.00 $4.00 Luke $5.30 $5.00 $5.25 $5.45 Mary $4.25 $4.50 $3.50 $3.75 Nancy $6.00 $4.00 $4.00 $6.00arrow_forward
- 2. A microwave manufacturing firm has determined that their profit function is P(x)=-0.0014x+0.3x²+6x-355 , where is the number of microwaves sold annually. a. Graph the profit function using a calculator. b. Determine a reasonable viewing window for the function. c. Approximate all of the zeros of the function using the CALC menu of your calculator. d. What must be the range of microwaves sold in order for the firm to profit?arrow_forwardA clothing manufacturer's profitability can be modeled by p (x)=-x4 + 40x² - 144, where .x is the number of items sold in thousands and p (x) is the company's profit in thousands of dollars. a. Sketch the function on your calculator and describe the end behavior. b. Determine the zeros of the function. c. Between what two values should the company sell in order to be profitable? d. Explain why only two of the zeros are considered in part c.arrow_forwardCCSS REASONING The number of subscribers using pagers in the United States can be modeled by f(x) = 0.015x4 -0.44x³ +3.46x² - 2.7x+9.68 where x is the number of years after 1990 and f(x) is the number of subscribers in millions. a. Graph the function. b. Describe the end behavior of the graph. c. What does the end behavior suggest about the number of pager subscribers? d. Will this trend continue indefinitely? Explain your reasoning.arrow_forward
- Can you help me solve this?arrow_forwardName Assume there is the following simplified grade book: Homework Labs | Final Exam | Project Avery 95 98 90 100 Blake 90 96 Carlos 83 79 Dax 55 30 228 92 95 79 90 65 60 Assume that the weights used to compute the final grades are homework 0.3, labs 0.2, the final 0.35, and the project 0.15. | Write an explicit formula to compute Avery's final grade using a single inner product. Write an explicit formula to compute everyone's final grade simultane- ously using a single matrix-vector product.arrow_forward1. Explicitly compute by hand (with work shown) the following Frobenius inner products 00 4.56 3.12 (a) ((º º º). (156 (b) 10.9 -1 0 2)), Fro 5')) Froarrow_forward
 Holt Mcdougal Larson Pre-algebra: Student Edition...AlgebraISBN:9780547587776Author:HOLT MCDOUGALPublisher:HOLT MCDOUGAL
 Glencoe Algebra 1, Student Edition, 9780079039897...AlgebraISBN:9780079039897Author:CarterPublisher:McGraw Hill
 Big Ideas Math A Bridge To Success Algebra 1: Stu...AlgebraISBN:9781680331141Author:HOUGHTON MIFFLIN HARCOURTPublisher:Houghton Mifflin Harcourt
 College Algebra (MindTap Course List)AlgebraISBN:9781305652231Author:R. David Gustafson, Jeff HughesPublisher:Cengage Learning
 College AlgebraAlgebraISBN:9781305115545Author:James Stewart, Lothar Redlin, Saleem WatsonPublisher:Cengage Learning